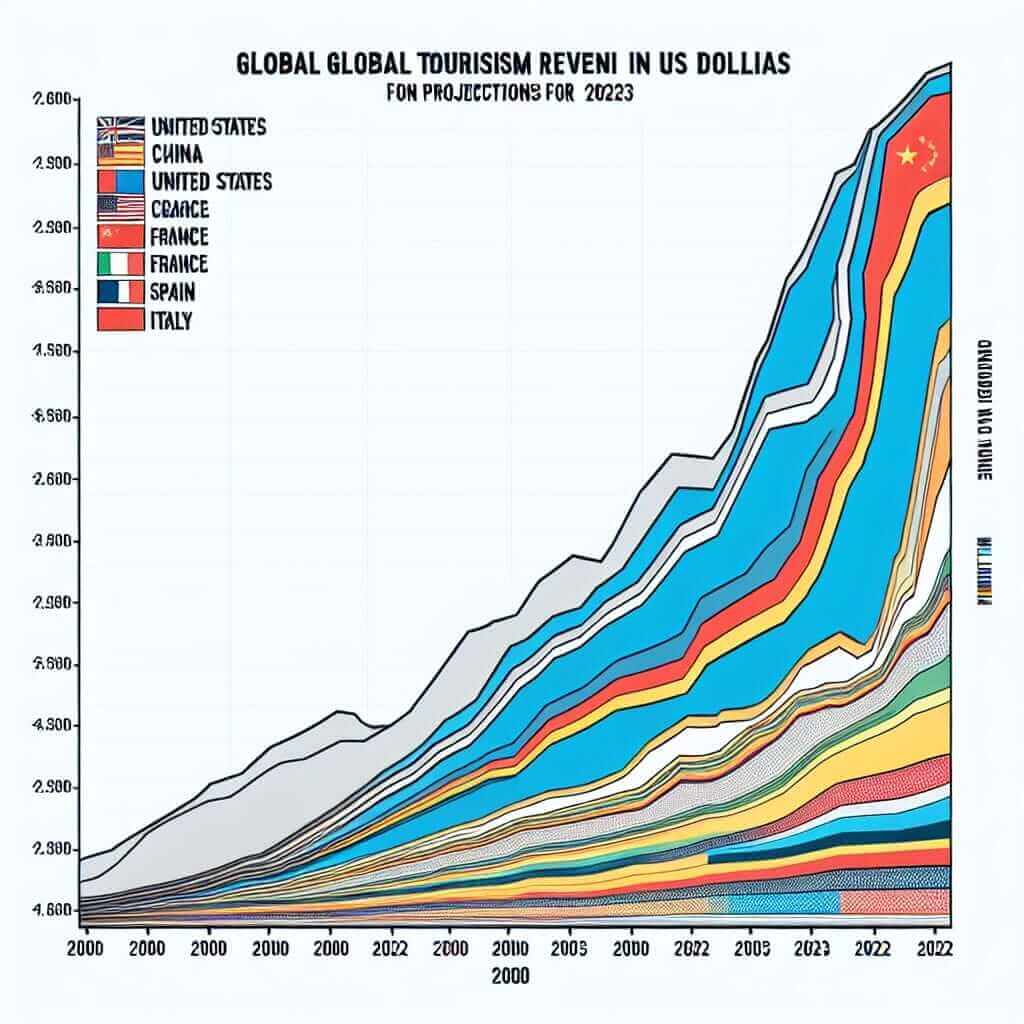
The IELTS Writing Task 1 often presents data in the form of graphs, charts, or tables, requiring you to describe the information accurately and coherently. “Tourism Revenue in Top Destinations (2000-2023)” is a topic that could appear in this section. This article guides you through analysing potential tasks related to this theme, equipping you with the skills to achieve a Band 7+ score.
Potential IELTS Writing Task 1 Questions:
-
The line graph shows the tourism revenue (in billions of US dollars) of the top 5 global destinations from 2000 to 2023. Summarise the information by selecting and reporting the main features and make comparisons where relevant.
-
The table illustrates the percentage change in tourism revenue for 10 of the most popular tourist destinations worldwide between 2020 and 2023. Write a report for a university lecturer describing the information shown.
-
The bar chart compares the tourism revenue generated from domestic tourism and international tourism in France, Spain, and Italy in 2023. Summarise the information by selecting and reporting the main features and make comparisons where relevant.
Sample Task & Model Answer:
Let’s select the first question to demonstrate a possible response:
The line graph shows the tourism revenue (in billions of US dollars) of the top 5 global destinations from 2000 to 2023. Summarise the information by selecting and reporting the main features and make comparisons where relevant.
(Insert a line graph here that you have created. The graph should depict fictional data for tourism revenue in five countries. Ensure your graph is clear, labelled, and easy to understand. You can use online tools to create graphs or simply describe the data you would hypothetically include.)

Analysis:
- Type of Graph: Line graph
- Time Period: 2000 – 2023
- Units: Billions of US dollars
- Key Information: Tourism revenue of the top 5 global destinations.
Model Answer:
The line graph provides an overview of tourism revenue generated by the five leading global destinations over a 23-year period, from 2000 to 2023.
At the start of the period, the United States dominated the tourism sector, earning approximately $40 billion, followed by France at roughly $30 billion. Spain and Italy lagged behind at around $20 billion and $15 billion, respectively, while China trailed significantly with revenue below $10 billion.
Over the following two decades, a clear upward trend in global tourism revenue was observed. Notably, China exhibited the most dramatic growth, with revenue skyrocketing from under $10 billion to over $70 billion by 2023, surpassing all other destinations. While the United States maintained a leading position, its growth was more gradual, reaching approximately $60 billion in 2023.
Interestingly, France, Spain, and Italy displayed relatively stable growth, experiencing only minor fluctuations throughout the period. By 2023, their tourism revenue hovered around $40 billion, $35 billion, and $25 billion, respectively.
In conclusion, the graph highlights the significant expansion of the global tourism industry, with China emerging as a dominant force. Despite this shift, established destinations like the United States and several European countries maintained their appeal, albeit with steadier growth patterns. (Word count: 194 words)
Writing Task 1 Tips:
- Paraphrase: Avoid copying the question word-for-word. Use synonyms and rephrase the introductory sentence.
- Overview: Provide a clear overview summarising the key trends shown in the graph.
- Selective Detail: Focus on the most significant changes, trends, and comparisons. Avoid describing every single data point.
- Accurate Language: Use appropriate vocabulary to describe trends (e.g., increase, decline, fluctuate) and make comparisons (e.g., higher than, lower than, similar to).
- Grammar and Cohesion: Ensure grammatical accuracy and use linking words to connect your ideas smoothly.
Essential Vocabulary:
- Revenue: (noun) /ˈrev.ə.nuː/ – Income generated from business operations.
- Destination: (noun) /ˌdes.tɪˈneɪ.ʃən/ – The place to which someone or something is going.
- Trend: (noun) /trend/ – A general direction of change or development.
- Fluctuate: (verb) /ˈflʌk.tʃu.eɪt/ – To rise and fall irregularly in number or amount.
- Surpass: (verb) /sərˈpæs/ – To exceed; be greater than.
Conclusion:
Mastering the IELTS Writing Task 1 requires a combination of analytical and language skills. By familiarizing yourself with common topics like tourism revenue and practicing your data interpretation, you can approach this section with confidence. Remember to maintain a clear structure, use precise vocabulary, and focus on conveying the key information accurately to achieve a Band 7+ score.