The subject of birth rate trends often appears in IELTS writing task 1. Understanding how to approach such tasks is key to achieving a high band score. This guide will help you analyze and write about birth rate trends effectively.
Understanding the Topic: Trends in Birth Rates (2000-2023)
Birth rates over the years can offer insightful analysis for writing tasks. Analyzing such trends helps to understand various factors affecting population growth and demographic changes. In IELTS, you might be asked to summarize data, compare changes, or describe trends accurately.
Sample Tasks for Practice
- Sample Task 1: The graph below shows the birth rates in Country A and Country B between 2000 and 2023. Summarize the information by selecting and reporting the main features, and make comparisons where relevant.
- Sample Task 2: The table provides data on the birth rates in five different continents from 2000 to 2023. Summarize the information by selecting and reporting the main features, and make comparisons where relevant.
- Sample Task 3: The pie charts illustrate the percentage distribution of birth rates across various age groups in 2000 and 2023. Summarize the information by selecting and reporting the main features, and make comparisons where relevant.
Choosing a Sample Task
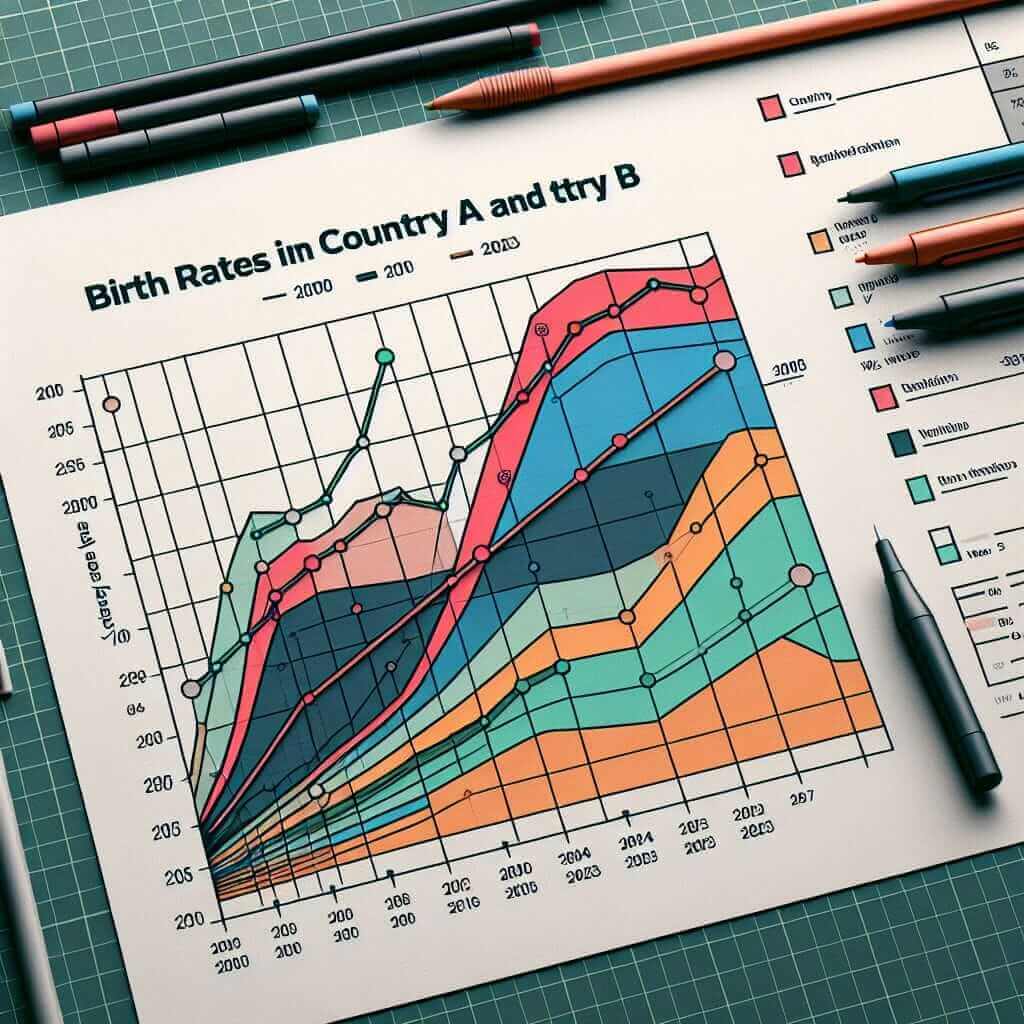
For this guide, we will focus on Sample Task 1: The graph below shows the birth rates in Country A and Country B between 2000 and 2023.
Creating a Graph
To make the writing practice practical, let’s consider the following data, presented in the form of a line graph:
| Year | Country A | Country B |
|---|---|---|
| 2000 | 15 | 20 |
| 2005 | 18 | 22 |
| 2010 | 14 | 19 |
| 2015 | 12 | 17 |
| 2020 | 10 | 16 |
| 2023 | 9 | 15 |
(The numbers represent birth rates per 1,000 people.)

Analyzing the Task
Task Requirements: Summarize the information by selecting and reporting the main features, and make comparisons where relevant.
Key Points to Note:
- Identify overall trends.
- Highlight significant changes.
- Compare the data between the two countries.
Writing Sample
Introduction:
The provided line graph illustrates the birth rates in Country A and Country B from 2000 to 2023.
Overview:
Overall, both countries show a declining trend in birth rates over the given period. However, it is noticeable that Country B consistently had a higher birth rate than Country A throughout the years.
Body Paragraph 1:
In 2000, Country B started off with a birth rate of 20 per 1,000 people, which was higher compared to Country A’s 15. Over the next five years, both countries saw an increase, with Country A rising to 18 and Country B to 22 in 2005. However, this upward trend was short-lived.
Body Paragraph 2:
From 2005 onwards, birth rates in both countries began to decline. Country A’s birth rate dropped significantly to 14 in 2010 and continued to fall to 12 in 2015. By 2023, it further reduced to 9 per 1,000 people.
In contrast, Country B experienced a more gradual decline. Its birth rate decreased to 19 in 2010 and then to 17 in 2015. By 2023, the birth rate in Country B was 15, maintaining a higher rate compared to Country A.
Conclusion:
To sum up, although both countries experienced a decline in birth rates from 2000 to 2023, Country B maintained a consistently higher birth rate than Country A throughout the period.
Word Count: 204
Important Considerations
-
Vocabulary and Phrases: Ensure the use of varied vocabulary and relevant phrases:
- “birth rate per 1,000 people”
- “upward/downward trend”
- “consistently higher/lower”
- “significant/gradual decline”
-
Grammar Structures: Utilize a range of grammatical structures:
- Past simple for specific events (e.g., “dropped significantly”)
- Present perfect for ongoing trends (e.g., “has been declining”)
-
Comparative Structures: Compare data effectively:
- Use comparative adjectives (e.g., “higher than”, “lower than”)
- Use connectors to show contrast (e.g., “However,”, “In contrast,”)
Vocabulary to Remember
- Decline (verb) /dɪˈklaɪn/: to decrease in quantity or importance.
- Consistent (adjective) /kənˈsɪstənt/: unchanging in nature, standard, or effect over time.
- Significant (adjective) /sɪɡˈnɪfɪkənt/: sufficiently great or important.
- Trend (noun) /trɛnd/: a general direction in which something is developing or changing.
- Gradual (adjective) /ˈɡrædʒuəl/: taking place or progressing slowly or by degrees.
Conclusion
When tackling an IELTS writing task 1 on birth rate trends, it’s critical to clearly identify and describe overall trends, significant changes, and key comparisons. Utilizing a range of vocabulary and grammatical structures effectively can significantly enhance your writing, positioning you well for a band 7+ score. Always remember to proofread your work for clarity and coherence. Happy writing!