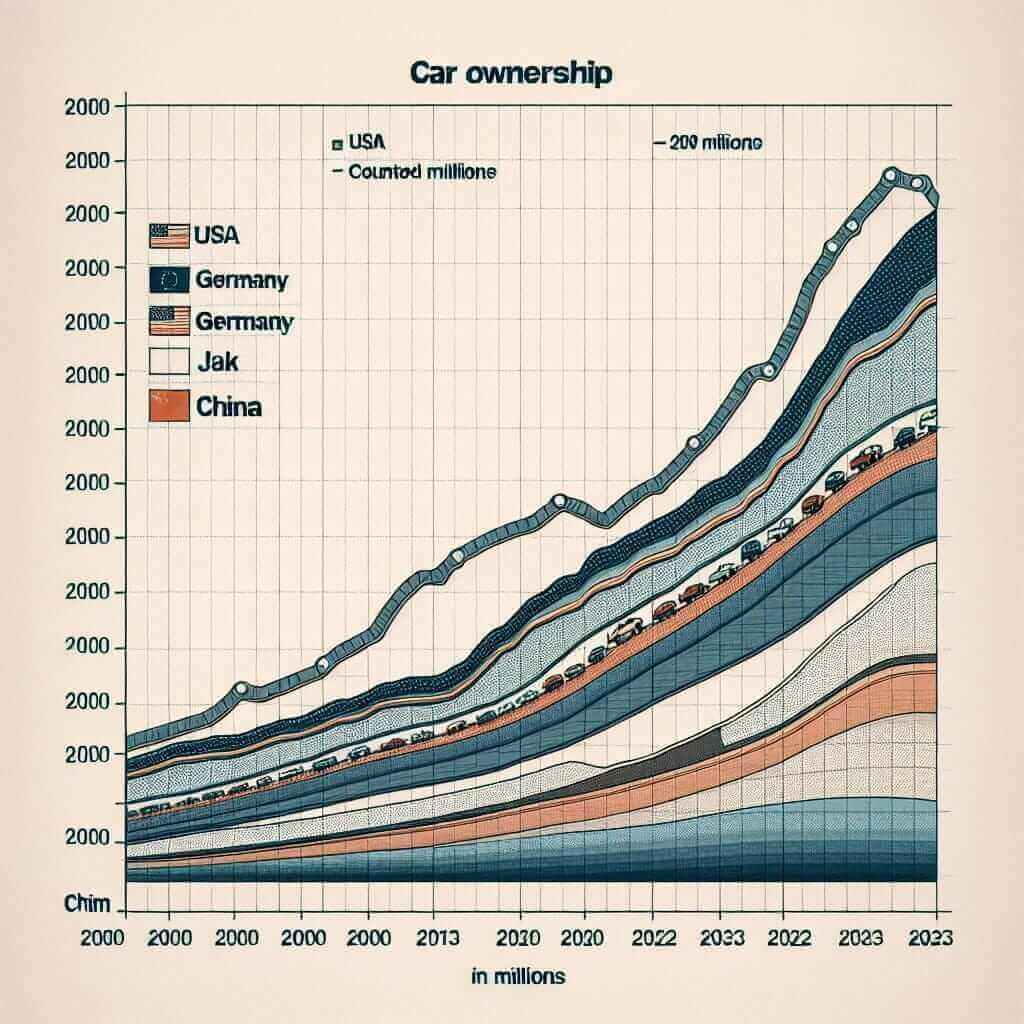
Understanding trends in car ownership is a crucial topic that frequently appears in the IELTS Writing Task 1. Analyzing data, whether in the form of graphs, tables, or charts, demands a particular set of skills. We will explore this topic comprehensively, offer insights into vocabulary and grammar, and provide a sample writing task based on real-world data. Let’s dive into the fascinating trends in car ownership from 2000 to 2023 and how you can ace this section of the IELTS exam.
Potential Examination Topics:
- “The line graph below shows the changes in car ownership in five different countries from 2000 to 2023.”
- “The table below shows the percentage of households with a car in three cities over a period from 2000 to 2023.”
- “The pie charts below illustrate the distribution of car types owned in the UK in the years 2000 and 2023.”
Selecting a Task
For this exercise, we’ll choose the first topic:
“The line graph below shows the changes in car ownership in five different countries from 2000 to 2023.”
Creating a Graph
To simulate an actual IELTS task, let’s imagine a line graph showcasing car ownership trends in the USA, UK, Germany, Japan, and China.

Analyzing the Task
Before we begin writing, it’s essential to thoroughly analyze the graph:
- X-axis: Years from 2000 to 2023.
- Y-axis: Number of cars owned (in millions).
- Key trends: Examine each country’s growth, peaks, and declines in car ownership over the period.
Writing the Response
Sample Response
Introduction
The line graph illustrates the number of cars owned in five different countries (USA, UK, Germany, Japan, and China) from 2000 to 2023.
Overview
Overall, car ownership increased in all five countries over the period, with the USA consistently having the highest number of cars. China saw the most significant growth, while the UK and Japan experienced more gradual increases.
Detailed Analysis
Starting in 2000, the USA had the highest car ownership at around 150 million, which steadily climbed to 200 million by 2023. Germany began with approximately 80 million cars and saw a moderate increase to 110 million cars in the same period.
China’s car ownership started relatively low at about 30 million in 2000 but surged dramatically, particularly from 2010 onwards, reaching nearly 150 million by 2023. The UK and Japan exhibited more stable growth patterns, with the UK increasing from 50 million to 70 million and Japan from 60 million to 75 million over the 23 years.
Word Count: 172
Key Writing Considerations
Vocabulary
- Surge (v) /sɜːrdʒ/: A sudden and significant increase (e.g., Car ownership surged in China).
- Gradual (adj) /ˈɡrædʒuəl/: Occurring in small stages over a period of time (e.g., The UK experienced a gradual increase in car ownership).
- Steady (adj) /ˈstedi/: Regular, even, and continuous development (e.g., The USA exhibited steady growth in car ownership).
- Moderate (adj) /ˈmɒdərət/: Average in amount, intensity, or degree (e.g., Germany’s increase in car ownership was moderate).
- Dramatic (adj) /drəˈmætɪk/: Sudden and significant (e.g., China’s growth was dramatic).
Grammar
- Comparative structures: Used to compare car ownership figures (e.g., The USA had the highest number of cars, whereas China saw the most significant increase).
- Prepositions of time: Essential for indicating periods (e.g., From 2000 to 2023).
- Past Simple and Present Perfect: For describing trends over time (e.g., Car ownership in Germany increased; Car ownership has been rising steadily).
Conclusion
By analyzing and interpreting trends in car ownership from 2000 to 2023, students can effectively tackle similar IELTS Writing Task 1 questions. The key is to use clear vocabulary, sound comparative structures, and accurate grammar to convey your findings. With practice and a focus on these areas, achieving a Band 7+ score becomes more attainable.