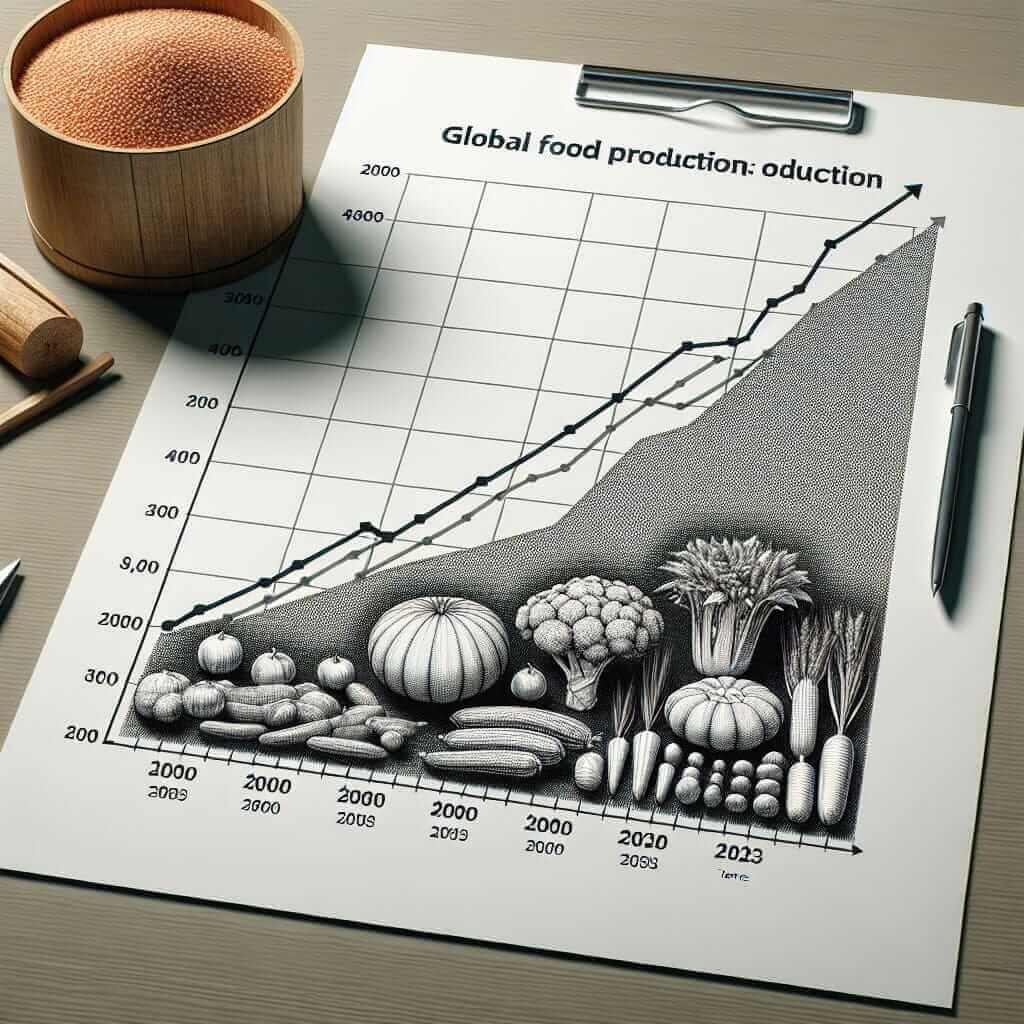
The IELTS Writing Task 1 often requires candidates to describe trends or data related to various topics, one of which can be global food production trends over a period of time. In this guide, we’ll explore “Trends in Global Food Production (2000-2023)” to help you prepare effectively for this kind of question. Understanding the trends and having a grasp of the related vocabulary and grammar is crucial for scoring high in the IELTS Writing Task 1.
Introduction
Analysis of the Topic
The topic “Trends in Global Food Production (2000-2023)” is a frequent area of interest in IELTS exams. This topic can be presented in various formats, such as line graphs, bar charts, or pie charts, depicting the rise or fall in food production over the specified period.
Sample Questions
Here are a few sample questions related to this topic:
- The line graph below shows the trends in global food production in millions of tonnes from 2000 to 2023. Summarize the information by selecting and reporting the main features, and make comparisons where relevant.
- The bar chart illustrates the changes in the production of various types of food globally between 2000 and 2023. Summarize the information by selecting and reporting the main features, and make comparisons where relevant.
- The table below provides data on the global production of major food categories from 2000 to 2023 in million tonnes. Summarize the information by selecting and reporting the main features, and make comparisons where relevant.
Detailed Insight: Trends in Global Food Production (2000-2023)
Let’s take one of the sample questions and delve deeper:
Selected Sample Question
“The line graph below shows the trends in global food production in millions of tonnes from 2000 to 2023. Summarize the information by selecting and reporting the main features, and make comparisons where relevant.”
Data and Visualization
Here is a hypothetical line graph illustrating the trends:

| Year | Grain Production (million tonnes) | Vegetable Production (million tonnes) | Meat Production (million tonnes) |
|---|---|---|---|
| 2000 | 2000 | 1500 | 1300 |
| 2005 | 2100 | 1700 | 1400 |
| 2010 | 2300 | 1800 | 1500 |
| 2015 | 2400 | 1900 | 1600 |
| 2020 | 2600 | 2100 | 1700 |
| 2023 | 2800 | 2200 | 1800 |
Analysis of the Question
When analyzing this question, you should look at:
- Overall trends (increasing or decreasing).
- Major changes or significant points.
- Comparisons between different food categories.
Sample Answer
The line graph illustrates the trends in global food production of three categories – grains, vegetables, and meat – measured in millions of tonnes from 2000 to 2023.
Overall, there has been a steady increase in the production of all three categories. Grain production began at 2000 million tonnes in 2000 and rose consistently, reaching 2800 million tonnes by 2023. Vegetable production followed a similar upward trajectory, starting at 1500 million tonnes in 2000 and climbing to 2200 million tonnes in 2023.
Meat production experienced a more gradual increase, beginning at 1300 million tonnes in 2000 and reaching 1800 million tonnes by 2023. It is noteworthy that grain and vegetable production showed larger absolute increases compared to meat production over the period in question.
In conclusion, while all categories of food production have increased steadily from 2000 to 2023, grains and vegetables exhibited more pronounced growth compared to meat.
(Word count: 153)
Key Considerations for Writing
Vocabulary and Grammar Notes
- Use proper comparative language: “larger than,” “more significant,” “increased more steadily.”
- Ensure your sentences are varied in structure: use of complex sentences and connecting words.
- Examples of vocabulary in context:
- Grain production began at 2000 million tonnes.
- Overall, there has been a steady increase in the production.
- Vegetable production followed a similar upward trajectory.
Key Vocabulary
- Trajectory (noun) /trəˈdʒektəri/: The path followed by a projectory flying or an object moving under the action of given forces.
- Steady (adjective) /ˈstedi/: Firmly fixed, supported, or balanced; not shaking or moving.
- Pronounced (adjective) /prəˈnaʊnst/: Very noticeable or marked; conspicuous.
- Upward (adjective) /ˈʌpwəd/: Moving or leading to a higher place or level.
- Measured (verb) /ˈmeʒə/: Ascertain the size, amount, or degree of something.
Conclusion
When tackling questions on trends in global food production, it is crucial to identify the main trends, compare different data points, and describe them using varied sentence structures and appropriate vocabulary. Practice these strategies to aim for a higher band score on the IELTS Writing Task 1. Remember, clear and concise writing, along with proper use of grammar, will help you excel in this task.