Global trade has been a pivotal factor in driving economic growth and development across the globe. It is a popular topic in the IELTS Writing Task 1 where candidates are required to describe trends in various data sets over time. The specific focus of this article is on the trends in global trade volume from 2000 to 2023.
In the IELTS exam, it is not uncommon to encounter questions related to trends over a period of time. Below are some possible questions related to this topic:
- The line graph shows the volume of global trade from 2000 to 2023. Summarize the information by selecting and reporting the main features, and make comparisons where relevant.
- The bar chart illustrates the trade volumes in different regions (e.g., Asia, Europe, America) from 2000 to 2023. Summarize the information by selecting and reporting the main features, and make comparisons where relevant.
- The table shows data on the global trade volumes in goods and services from 2000 to 2023. Summarize the information by selecting and reporting the main features, and make comparisons where relevant.
Selected Task
For this article, we will focus on the first possible question:
“The line graph shows the volume of global trade from 2000 to 2023. Summarize the information by selecting and reporting the main features, and make comparisons where relevant.”
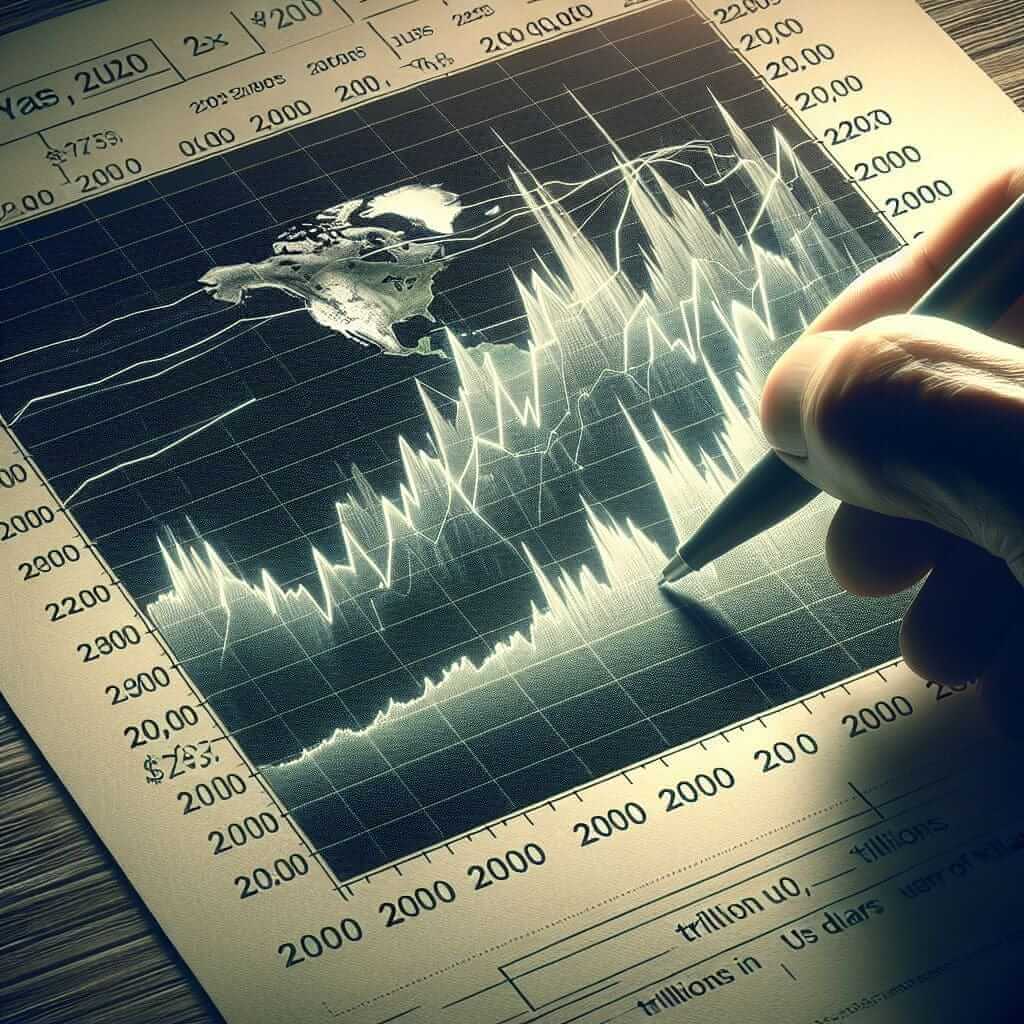
Below is a self-created line graph to represent data for the analysis.
Line Graph
    (Graph here)
   Title: Global Trade Volume from 2000 to 2023
   Y-Axis: Trade Volume (Trillions of US dollars)
   X-Axis: Year
   Data Points:
     2000: 6 Trillion
     2003: 8 Trillion
     2007: 10 Trillion
     2010: 12 Trillion
     2013: 14 Trillion
     2016: 12 Trillion
     2019: 15 Trillion
     2020: 13 Trillion
     2022: 16 Trillion
     2023: 17 Trillion
Global Trade Volume from 2000 to 2023
Analysis of the Task
Understanding the Question
The task requires an analysis of changes in global trade volume over a period of 23 years. It is essential to identify key trends, peaks, and troughs, and potential reasons for these changes.
Sample Answer
The line graph illustrates the trajectory of global trade volume from 2000 to 2023, measured in trillions of US dollars. Over this period, there have been significant fluctuations, reflecting various economic conditions worldwide.
In 2000, the global trade volume stood at 6 trillion dollars. The initial period witnessed a steady increase, reaching 8 trillion by 2003 and continuing to rise, hitting 10 trillion in 2007. This upward trend was consistent until 2010 when the volume surged to 12 trillion dollars.
However, the period following 2010 saw variations. By 2013, the trade volume expanded to 14 trillion but then experienced a dip down to 12 trillion in 2016. The subsequent years showed a recovery, with figures escalating to 15 trillion by 2019. The onset of the COVID-19 pandemic in 2020 temporarily contracted the trade volume to 13 trillion dollars.
Post-2020, the global trade volume rebounded, reaching 16 trillion in 2022 and further increasing to 17 trillion by 2023. This data reveals that despite temporary declines, the overall trend in global trade volume has been upward, signifying resilience and recovery in global economic activities.
(Word count: 191)
Key Considerations in Writing Task 1
When tackling similar questions in IELTS Writing Task 1, here are some key points to remember:
- Introduction: Briefly describe what the graph/chart/table shows.
- Overview: Summarize the main trends without delving into too much detail.
- Details: Present specific data points, compare and contrast where necessary.
- Language: Use varied vocabulary and grammar structures to avoid repetition.
Vocabulary and Grammar Tips
Key Vocabulary for Trends
- Surge
- Dip
- Peak
- Recover
- Decline
- Escalate
- Contract
- Plateau
Sample Sentences Using Key Vocabulary
- The trade volume surged from 10 trillion in 2007 to 12 trillion in 2010.
- There was a notable dip in 2016, where the volume dropped to 12 trillion.
- Post-2020, the global trade volume recovered swiftly.
Advanced Grammar Structures
- Complex Sentences: “Despite a significant dip in 2020, the trade volume managed to recover and climb to 17 trillion by 2023.”
- Passive Voice: “The trade volume was significantly impacted by global economic conditions.”
Challenging Vocabulary
- Trajectory (n) /trəˈdʒektəri/: The path followed by a moving object.
- Fluctuation (n) /ˌflʌk.tʃuˈeɪ.ʃən/: An irregular rising and falling in number or amount.
- Resilience (n) /rɪˈzɪl.i.əns/: The capacity to recover quickly from difficulties.
- Contraction (n) /kənˈtræk.ʃən/: The process of becoming smaller.
- Escalate (v) /ˈes.kə.leɪt/: Increase rapidly.
Conclusion
To achieve a high band score in IELTS Writing Task 1, it is crucial to present a clear, concise, and well-organized response. Focus on accurately describing data, highlighting key trends, and employing a variety of vocabulary and grammatical structures. By following these guidelines, you can effectively address any data-based task similar to the analysis of global trade volume trends.


