Water consumption trends have been a paramount concern in global discussions due to their environmental and socioeconomic impacts. In the IELTS Writing Task 1, analyzing such a critical topic effectively can significantly impact your band score. This article will delve into the key components necessary for writing a compelling response about global water consumption trends from 2000 to 2023.
Understanding the Topic and Creating Sample Questions
The theme “Trends in Global Water Consumption (2000-2023)” often appears in IELTS Writing Task 1. It requires examining data to identify patterns and make comparisons or summarizations. Here are three sample questions you might encounter:
- Sample Question 1: The graph below shows global water consumption by agriculture, industry, and domestic sectors between 2000 and 2023. Summarize the information by selecting and reporting the main features and make comparisons where relevant.
- Sample Question 2: The chart illustrates water usage per capita in different regions from 2000 to 2023. Summarize the information by selecting and reporting the main features and making comparisons where relevant.
- Sample Question 3: The table shows the percentage change in water consumption in various continents from 2000 to 2023. Summarize the information by selecting and reporting the main features and making comparisons where relevant.
Choosing and Analyzing a Sample Question
Selected Sample Question
Let’s use Sample Question 1 for our detailed analysis and writing sample.
Graph Creation and Analysis
We will create a hypothetical graph for illustrative purposes:
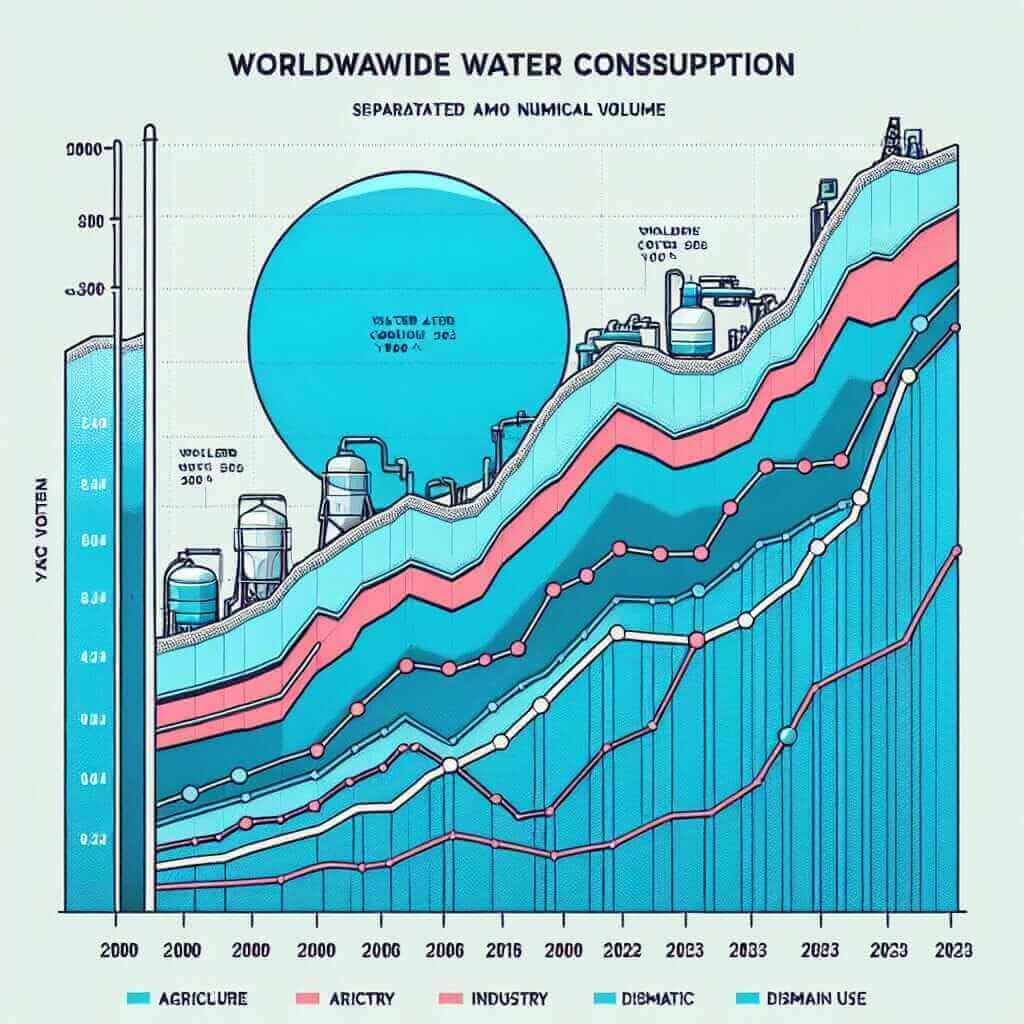
Global Water Consumption by Sector (2000-2023)
| Year | Agriculture (billion cubic meters) | Industry (billion cubic meters) | Domestic (billion cubic meters) |
|---|---|---|---|
| 2000 | 2500 | 800 | 350 |
| 2005 | 2600 | 850 | 400 |
| 2010 | 2700 | 900 | 450 |
| 2015 | 2800 | 950 | 500 |
| 2020 | 2900 | 1000 | 550 |
| 2023 | 3000 | 1050 | 600 |
(Replicate this graph or use similar visuals based on actual data for realism)

Writing Sample Answer
Analyzing the Chart
Firstly, identify trends such as increases, decreases, or fluctuations in each sector’s water consumption. Notice if there are peaks or plateaus.
Sample Writing Response
The graph illustrates global water consumption trends in agriculture, industry, and domestic sectors from 2000 to 2023.
Overall, water usage in all three sectors has shown a significant upward trend. Agriculture consistently consumed the highest amount of water, while the domestic sector had the lowest usage throughout the period.
In 2000, agriculture accounted for 2500 billion cubic meters, which gradually increased to 3000 billion cubic meters by 2023. This sector’s demand for water grew steadily, reflecting a rise of 500 billion cubic meters over the 23-year span. Similarly, industrial water consumption saw a notable increase, starting at 800 billion cubic meters in 2000 and reaching 1050 billion cubic meters by 2023.
The domestic sector, though the lowest in consumption, also exhibited a substantial rise from 350 billion cubic meters in 2000 to 600 billion cubic meters in 2023. The demand for water in this sector almost doubled, illustrating the growing need for water in households worldwide.
In summary, the data indicates an across-the-board increase in water usage among all three sectors, with agriculture being the dominant consumer. The upward trend suggests a continual rise in water demand corresponding with global population and industrial expansion.
Word Count: 200
Key Vocabulary and Grammar
Vocabulary
- Consumption (noun): the action of using up a resource.
- Sector (noun): an area or portion distinct from others.
- Billion cubic meters (noun phrase): a unit of measurement for large volumes of water.
- Upward trend (noun phrase): a general rise in data over time.
- Domestic (adjective): related to home or family.
Grammar and Usage Tips
-
Comparative Structures: “more than,” “less than,” “as much as.”
- Example: “Water usage in agriculture is more than twice that of the domestic sector.”
-
Passive Voice for Emphasis: Used to emphasize the action rather than the subject.
- Example: “Water consumption in the industry was increased.”
-
Quantifiers and Measurements: Use precise quantifiers for clarity.
- Example: “2500 billion cubic meters.”
Conclusion
Writing a high-scoring response for a topic like global water consumption trends in the IELTS Writing Task 1 involves a clear understanding of data presentation and effective use of vocabulary and grammar. Aim to identify key trends, use comparative structures, and ensure your response is well-organized and concise. Practice with real-life data to enhance your analytical skills, targeting Band 7+ in your examination.