In the realm of economic analysis, the examination of household savings rates has been a persistent theme, particularly owing to its implications for financial stability and growth. For IELTS candidates, understanding this topic is crucial as it frequently appears in writing tasks, especially in IELTS Writing Task 1 where you’re required to describe and analyze trends from charts, graphs, or tables. Today, we’ll delve into the trends of household savings rates from 2000 to 2023, and I will guide you through creating a compelling piece based on this data.
Sample Task
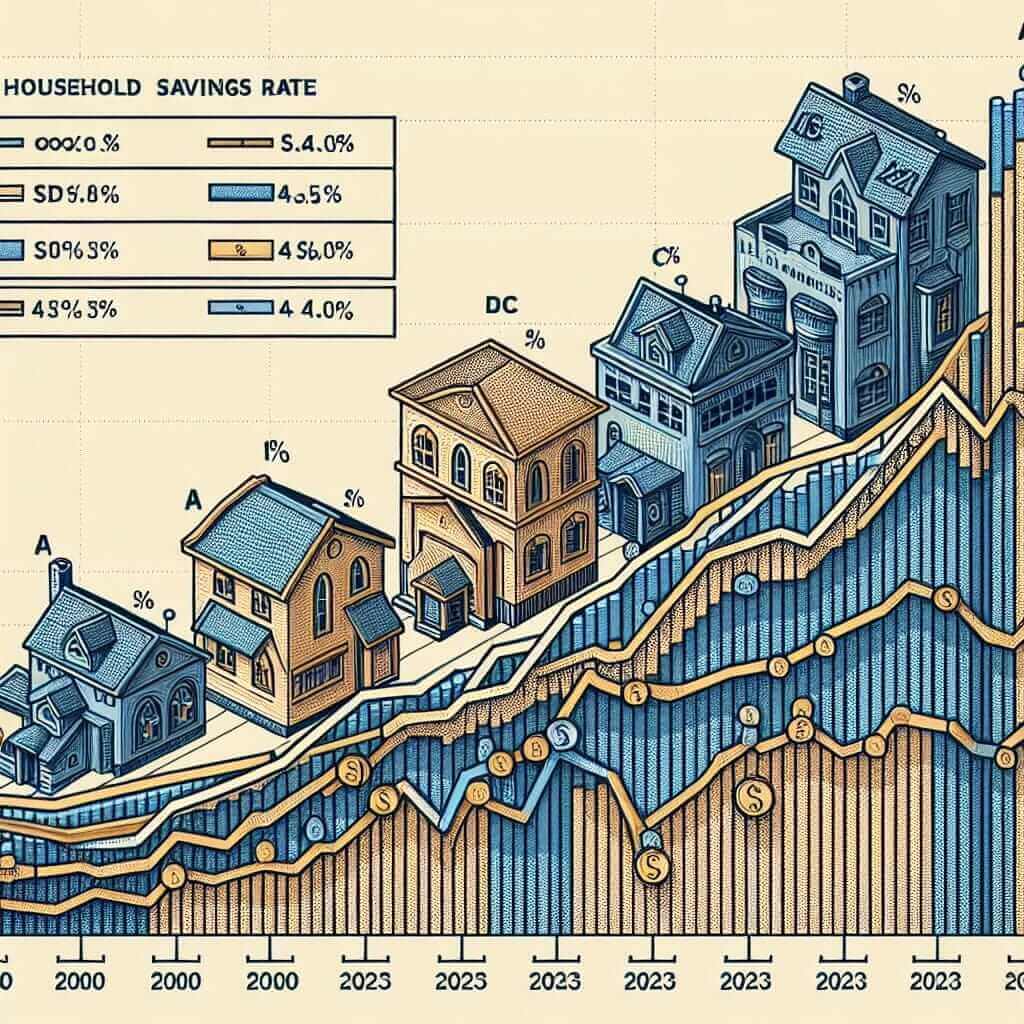
Task 1: The graph below shows the household savings rates for four countries (A, B, C, and D) between the years 2000 and 2023. Summarize the information by selecting and reporting the main features, and make comparisons where relevant.

Main Content
Selecting the Task
We’ll use Task 1 as our primary focus to create a sample writing task. This set of data will help us illustrate the variations in household savings rates across four countries over the given period.
Data Analysis
Before we write, let’s inspect the data available. For instance, Country A might show a steady increase, Country B a fluctuation with a sharp rise, Country C a gradual decline, and Country D stability with minor changes.
Writing Sample Response
Step 1: Introduction
The introduction should briefly state what the graph is about without going into specific details.
Example:
The line graph illustrates the household savings rates in percentages for four countries from 2000 to 2023.
Step 2: Overview
Highlight the overall trend or the most noticeable feature of the graph.
Example:
Overall, the household savings rates in the four countries show diverse trends over the given period, with some countries experiencing significant fluctuations while others depict more stable patterns.
Step 3: Detailed Paragraph 1
Describe the data for the first two countries.
Example:
At the start of the period, Country A had a savings rate of around 5%. This rate saw a consistent increase, peaking at 20% in 2020 before stabilizing. In contrast, Country B exhibited considerable variation. Starting at 10% in 2000, it dipped to 5% in 2008, followed by a sharp increase, reaching its peak at 25% in 2022.
Step 4: Detailed Paragraph 2
Describe the data for the remaining countries.
Example:
Country C’s savings rate started high at 15% but experienced a steady decline over the period, dropping to 7% by 2023. Meanwhile, Country D maintained a relatively stable savings rate, fluctuating minimally between 12% and 14% throughout the years from 2000 to 2023.
Step 5: Conclusion (if needed)
Summarize your findings briefly.
Example:
To summarize, while some countries displayed significant changes in household savings rates, others maintained stability, reflecting varied economic conditions and possibly differing saving behaviors among households.
Word Count: 217 words
Tips for Writing
- Use Clear and Comparisons: Use comparative language clearly. Phrases like “in contrast,” “while,” “compared to,” can be very helpful.
- Avoid Over-Complex Sentences: Clarity is crucial. Complex sentences can often lead to mistakes.
- Use Specific Vocabulary: Words like “fluctuate,” “peak,” “dip,” “stable,” and “increase steadily” are essential for describing trends accurately.
Vocabulary Highlights
- Fluctuate (v) /ˈflʌktʃueɪt/: to vary irregularly
- The rates fluctuated throughout the period.
- Peak (v/n) /piːk/: reach the highest point
- The savings rate peaked in 2020.
- Decline (v/n) /dɪˈklaɪn/: to decrease
- There was a steady decline in the savings rate.
- Stable (adj) /ˈsteɪbəl/: not easily changed
- Country D’s savings rates remained stable.
- Steady (adj) /ˈstedi/: consistent
- The increase was steady over the years.
Conclusion
To achieve a Band 7 or higher in IELTS Writing Task 1, it is imperative to accurately describe, compare, and summarize key features of graph data. Remember to use specific vocabulary and maintain clarity in your sentences. By practicing with real data, like the trends in household savings rates from 2000 to 2023, and employing the tips provided, you can improve your descriptive and analytical writing skills significantly.