Understanding trends in household spending patterns is a common topic in IELTS Writing Task 1, as it often requires candidates to analyze charts and graphs. This article will provide insights into how to effectively address this topic, including a sample essay, vocabulary, and grammatical tips to achieve a high score.
Introduction
Household spending patterns have significantly evolved from 2000 to 2023. These changes are often examined in IELTS Writing Task 1, where candidates are required to describe and analyze data from various types of visual information such as pie charts, bar graphs, and line charts. This article will give you a comprehensive guide on how to tackle such questions.
Below are some example questions related to the topic:
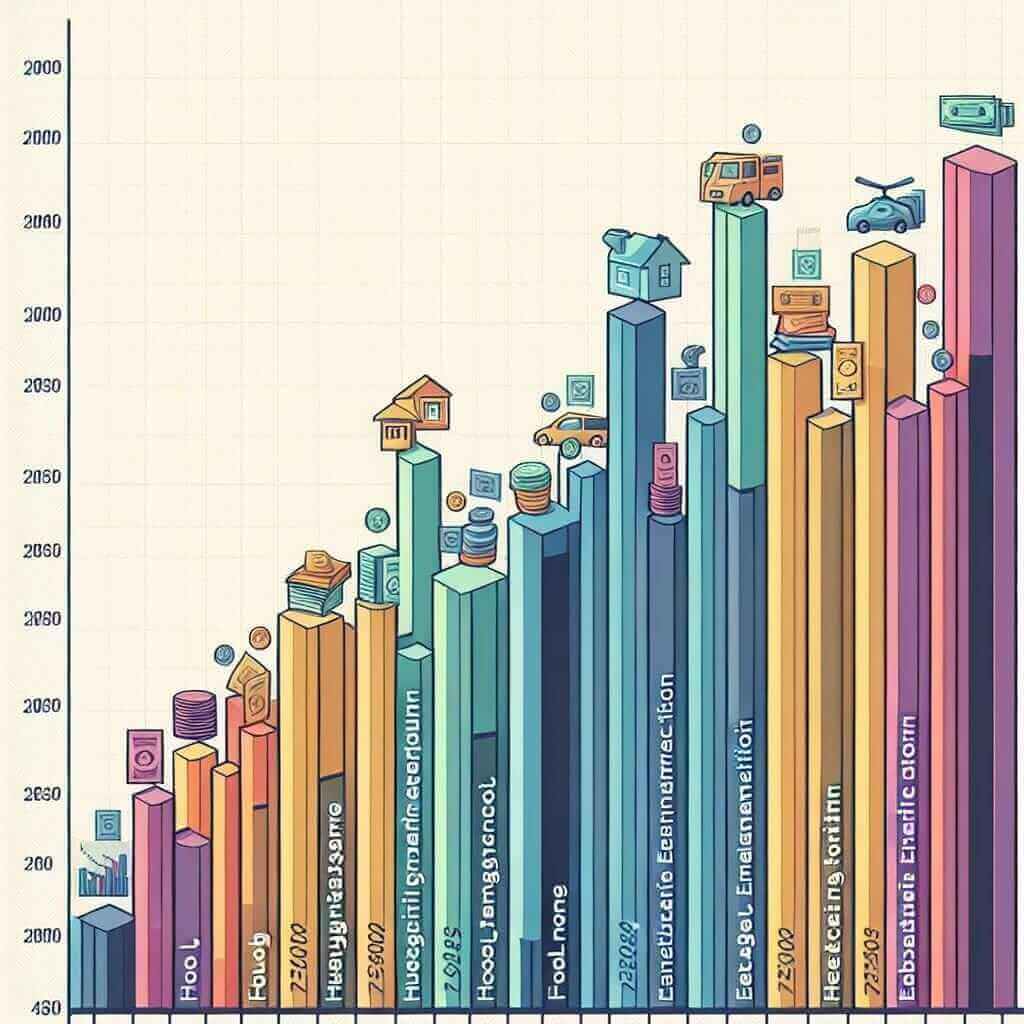
- The bar chart below shows the household expenditure in different categories between 2000 and 2023. Summarize the information by selecting and reporting the main features and make comparisons where relevant.
- The line graph below illustrates the changes in household spending patterns from 2000 to 2023 in three different countries. Summarize the information by selecting and reporting the main features and make comparisons where relevant.
- The pie charts below compare the household spending distribution in 2000 and 2023. Summarize the information by selecting and reporting the main features and make comparisons where relevant.
For this article, we will focus on the first question.
Data and Analysis
Sample Question
The bar chart below shows the household expenditure in different categories between 2000 and 2023. Summarize the information by selecting and reporting the main features and make comparisons where relevant.

Created Data Table
| Expenditure Category | 2000 (%) | 2023 (%) |
|---|---|---|
| Housing | 30 | 35 |
| Food | 20 | 15 |
| Transportation | 10 | 20 |
| Healthcare | 5 | 10 |
| Education | 10 | 5 |
| Entertainment | 15 | 10 |
| Other | 10 | 5 |
Analysis of the Question
Key Points to Address:
- Noticeable trends in household expenditure from 2000 to 2023.
- Categories that have increased, decreased, or remained stable.
- Comparisons between the most and least significant changes in spending.
Describing Trends:
- Increasing Trends: Categories such as housing, transportation, and healthcare saw a rise in spending.
- Decreasing Trends: Spending on food, education, entertainment, and other categories dropped.
- Stable Categories: Categories where changes are minimal.
Sample Essay
The bar chart compares household expenditure across seven categories between the years 2000 and 2023. Overall, the data reveals an increase in spending on housing, transportation, and healthcare, while other categories experienced a decline or remained relatively steady.
In 2000, housing accounted for the highest expenditure at 30%. This figure rose to 35% by 2023, indicating steady growth. Similarly, transportation and healthcare expenditures saw noticeable increments, with transportation rising from 10% to 20% and healthcare from 5% to 10%. These categories reflect a growing emphasis on mobility and health.
Conversely, the percentage of expenditure on food decreased from 20% in 2000 to 15% in 2023. Education and entertainment also saw reductions, with education dropping from 10% to 5% and entertainment from 15% to 10%. The ‘Other’ category experienced a 50% decline, reducing from 10% to 5%.
Overall, the data suggest a shift in household spending priorities over the 23-year span, with increased costs in essential areas like housing and healthcare, while discretionary spending such as entertainment and food have diminished.
(Word Count: 180)
Important Note on Writing
Vocabulary & Grammar Tips
Useful Vocabulary
- Expenditure (n) /ɪkˈspɛndɪtʃə/: The action of spending funds.
- Account for (v): To constitute a specific amount.
- Increment (n) /ˈɪŋkrɪmɛnt/: An increase or addition.
- Conversely (adv) /kənˈvɜːsli/: Introducing a statement or idea that reverses one that has just been made.
- Decline (n/v) /dɪˈklaɪn/: A gradual reduction in the amount.
- Discretionary (adj) /dɪˈskrɛʃənəri/: Available for use at the discretion of the user.
Grammar Tips
- Use of Tenses: Use past tense to describe data from 2000 and use present perfect or simple present to describe data from 2023.
- Comparative Structures: Use comparatives and superlatives when discussing changes (e.g., higher than, more significant increase, etc.).
- Linking Words: Use linking words to enhance coherence (e.g., furthermore, however, consequently, etc.).
Key Takeaways
- Pay close attention to the main features in the data.
- Make relevant comparisons and avoid listing every single figure.
- Use a range of vocabulary and grammatical structures to achieve higher scores.
Conclusion
Successfully addressing the task requires an understanding of the key features of the data and the ability to clearly and coherently describe those features. Following these tips and using the analyzed essay structure can help you score a Band 7 or higher in the IELTS Writing Task 1. Understanding how household spending patterns shift over time can provide context and clarity in your descriptions and comparisons.