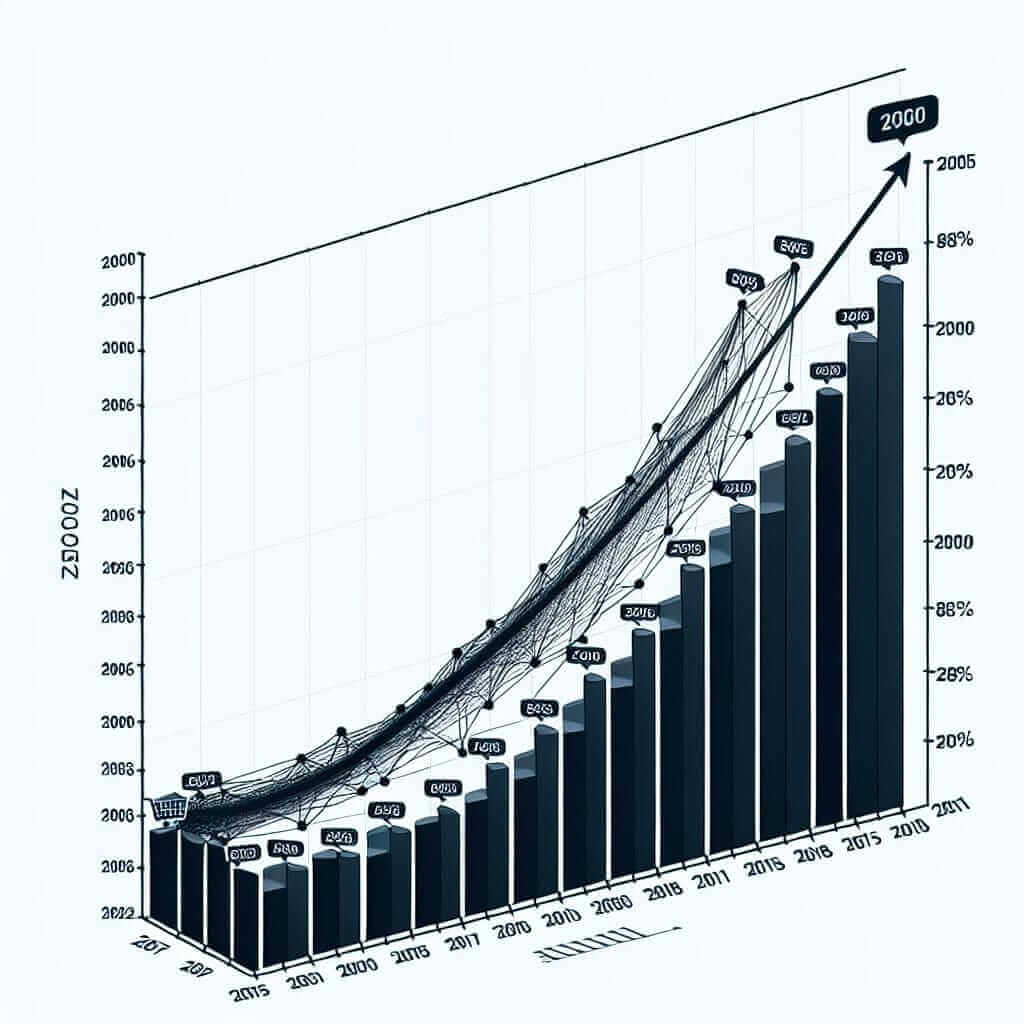
In the IELTS Writing Task 1, candidates are often required to describe and interpret data from various types of visual information, including tables, bar charts, line graphs, and pie charts. One common topic area is “Trends in Online Shopping Behavior.” This topic has become increasingly relevant due to technological advancements and the shift in consumer behavior over the past two decades.
Nội dung bài viết
Example Tasks:
- The line graph below shows the percentage of people purchasing products online from 2000 to 2023.
- The bar chart illustrates the different categories of products purchased online in 2000, 2010, and 2023.
- The pie charts compare the popularity of online shopping platforms in 2000, 2010, and 2023.
Detailed Analysis
Selected Task:
The line graph below shows the percentage of people purchasing products online from 2000 to 2023.
Write a report for a university lecturer describing the information shown below.
Data Creation:
For this task, we will create a fictional line graph:
Percentage of People Purchasing Products Online (2000-2023)
| Year | Percentage |
|---|---|
| 2000 | 15% |
| 2005 | 25% |
| 2010 | 45% |
| 2015 | 60% |
| 2020 | 75% |
| 2023 | 85% |

Graph Analysis
The line graph illustrates the increasing trend in the percentage of people purchasing products online from 2000 to 2023.
- Clear upward trend observable.
- Initial five years (2000-2005): gradual increase.
- Significant rise between 2005 and 2010.
- Continued growth with more substantial increments evident from 2010 onward.
- Peak in 2023 with 85% of people engaging in online shopping.
Writing Sample:
Introduction:
The provided line graph depicts the percentage of people who purchased products online between the years 2000 and 2023.
Overview:
Overall, the data indicates a significant and consistent increase in the proportion of online shoppers throughout the given period.
Detailed Paragraphs:
In the year 2000, only 15% of the population engaged in online shopping. This figure rose gradually to 25% by 2005. A noteworthy surge is evident from 2005 to 2010, where the percentage almost doubled, reaching 45%.
From 2010 onwards, the growth rate of online shopping adoption accelerated further. By 2015, 60% of people were shopping online, continuing to rise sharply to 75% in 2020. Finally, the percentage peaked at 85% in 2023.
Word Count:
The above text contains 125 words.
Tips for Writing
Vocabulary and Grammar:
- Upward trend (n): Used to describe a consistent rise.
- Surge (n): A sudden large increase.
- Gradual (adj): Slow but steady.
- Accelerate (v): To increase speed.
Example Sentences:
- “The line graph illustrates an upward trend in the percentage of people purchasing products online from 2000 to 2023.”
- “A surge is evident between the years 2005 and 2010.”
- “The growth was gradual during the initial five years.”
- “The adoption rate began to accelerate significantly in 2010.”
Notes on Vocabulary:
- Upward trend (n):
- Meaning: A consistent increase over time.
- Example: The upward trend continued throughout the period.
- Surge (n):
- Meaning: A sudden, large increase.
- Example: There was a surge in online shopping from 2005 to 2010.
- Gradual (adj):
- Meaning: Slow and steady.
- Example: The increase was gradual at first.
- Accelerate (v):
- Meaning: To gain speed.
- Example: The growth rate accelerated after 2010.
Common Mistakes to Avoid:
- Incorrect Tense Use: Ensure to use the correct tense when describing trends. Generally, past simple tense is suitable for previous years.
- Word Count: Aim for a concise yet comprehensive description; typically, between 150-200 words.
- Data Misinterpretation: Always double-check the data to avoid misrepresenting the trends.
Conclusion
When approaching IELTS Writing Task 1, focus on accurately describing the data provided. Use relevant vocabulary, maintain grammatical accuracy, and present a clear structure. Practicing with recent trends, such as online shopping behavior from 2000 to 2023, can help in understanding and articulating similar tasks effectively.
Achieving a Band 7+ requires clear interpretation, precise vocabulary use, and structured responses. Always practice with various types of visual data and seek feedback to refine your writing skills.