In this lesson, we’ll explore the trends in urban population density from 2000 to 2023. This topic is highly relevant for IELTS Writing Task 1, as it often features in recent examinations. Understanding this topic will not only help you accurately describe data but also improve your overall writing skills.
To start with, let’s look at a few sample IELTS Writing Task 1 prompts related to this topic:
Sample IELTS Writing Task 1 Prompts
- Prompt 1: “The bar chart below shows the urban population density in several major cities from 2000 to 2023. Summarize the information and make comparisons where relevant.”
- Prompt 2: “The line graph below illustrates the changes in urban population density in three different continents between 2000 and 2023. Summarize the information by selecting and reporting the main features and make comparisons where relevant.”
- Prompt 3: “The table below displays the average population density in urban areas of various countries from 2000 to 2023. Summarize the information and make comparisons where necessary.”
Choosing a Prompt & Data Representation
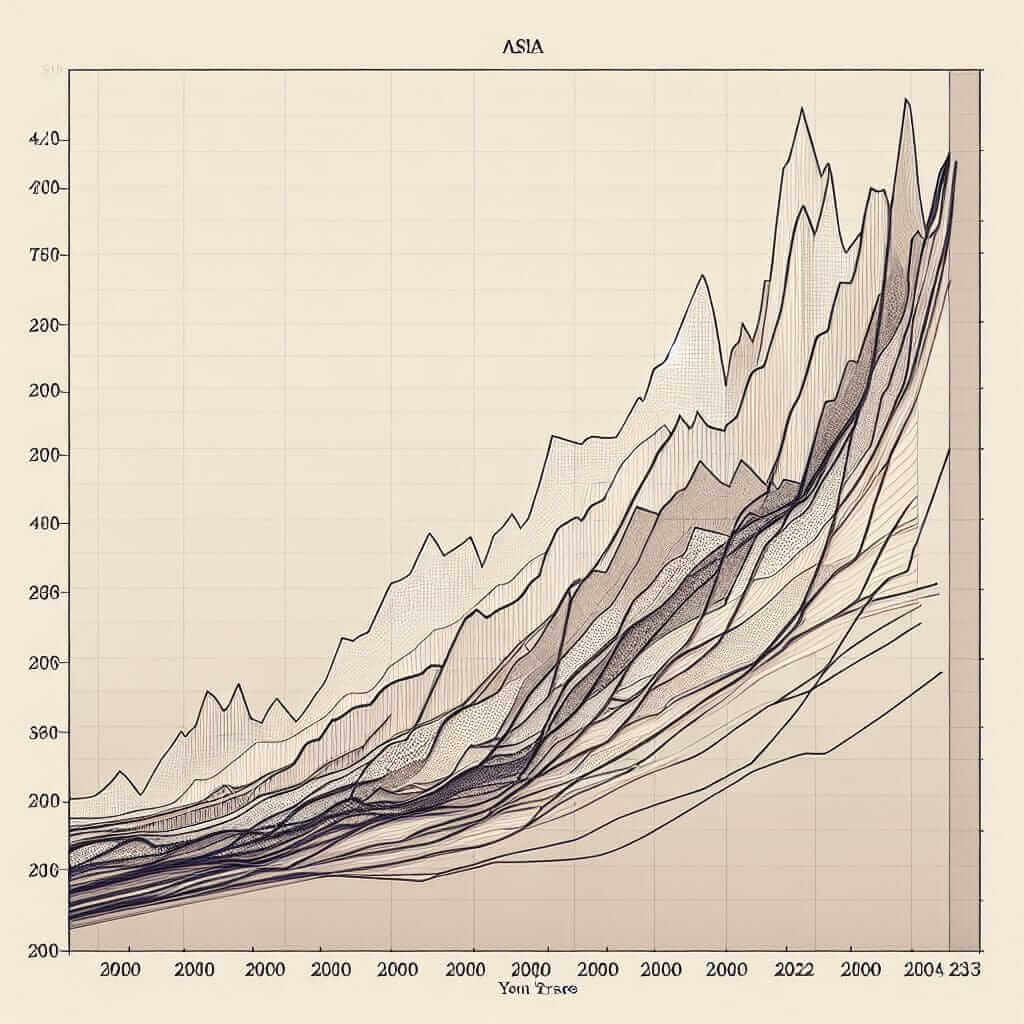
Let’s choose Prompt 2 for our detailed analysis and create a line graph with hypothetical data to represent urban population density in three continents: Asia, Europe, and North America.
Hypothetical Data for Line Graph
| Year | Asia | Europe | North America |
|---|---|---|---|
| 2000 | 800 | 400 | 600 |
| 2005 | 900 | 450 | 650 |
| 2010 | 1000 | 500 | 700 |
| 2015 | 1100 | 550 | 750 |
| 2020 | 1200 | 600 | 800 |
| 2023 | 1300 | 650 | 850 |
Line Graph Representation

Analyzing the Prompt
Let’s break down Prompt 2 for better clarity:
- Task Type: Line graph illustrating changes in urban population density.
- Time Period: 2000 to 2023.
- Regions: Asia, Europe, and North America.
- Main Features: Identify trends, compare regions, highlight significant changes.
Sample Writing Task 1 Answer
Below is a sample response for the chosen prompt:
The line graph illustrates the changes in urban population density in Asia, Europe, and North America from 2000 to 2023.
Overall, it is evident that the urban population density has been consistently increasing in all three continents over the given period. Asia has the highest urban population density, followed by North America and Europe.
In 2000, Asia’s urban population density started at 800 people per square kilometer, significantly higher than North America’s 600 and Europe’s 400. By 2005, Asia saw a considerable rise to 900, while North America and Europe increased slightly to 650 and 450, respectively.
Moving to 2010, the upward trend continued, with Asia reaching 1000, North America 700, and Europe 500. The following five years experienced similar growth patterns, with all continents seeing a steady increase of approximately 100 people per square kilometer per five years.
The period between 2015 and 2020 marked a more pronounced growth, especially for Asia, which surged to 1200 by 2020. North America and Europe also showed significant increments, reaching 800 and 600, respectively.
By 2023, Asia’s urban population density peaked at 1300, maintaining its position as the continent with the densest urban populations. North America and Europe finished the period with densities of 850 and 650, respectively.
In summary, all three continents displayed a notable increase in urban population density between 2000 and 2023, with Asia leading the trajectory throughout the period.
(230 words)
Key Vocabulary and Grammar Points
Vocabulary to Remember
- Urban (adj) /ˈɜːr.bən/: Relating to a city or town.
- Density (n) /ˈdɛn.sə.ti/: The number of people or things in a given area.
- Consistently (adv) /kənˈsɪs.tənt.li/: In a way that does not change.
- Pronounced (adj) /prəˈnaʊnst/: Very noticeable.
- Trajectory (n) /trəˈdʒek.tər.i/: The path followed by an object moving through space.
Grammar Points
Comparatives and Superlatives
- Comparatives: Use for comparing two entities (e.g., “Asia had a higher density than North America”).
- Superlatives: Use for comparing more than two entities, where one is the highest (e.g., “Asia had the highest urban population density”).
Trend Descriptions
- Use past, present perfect, and future perfect tenses to describe trends and changes over time. For example:
- “The density has increased consistently.”
- “By 2023, the density will have reached 1300.”
Conclusion
Understanding and analyzing trends in urban population density from 2000 to 2023 involves identifying key figures and comparing changes over time. Utilizing precise vocabulary and appropriate grammatical structures can significantly enhance the quality of your writing. By following the guidelines and practicing consistently, you can aim to achieve a Band 7+ score in your IELTS Writing Task 1.