Overview of Task Type and Frequency
The analysis of unemployment rates across different education levels is a common theme in IELTS Writing Task 1. Such tasks typically appear in the form of line graphs or bar charts, requiring candidates to describe trends and make comparisons over time periods.
Sample question types:
- The line graph shows unemployment rates for different education levels from 2000 to 2023 in Country X.
- The bar chart compares unemployment percentages among various educational qualifications over two decades.
- The mixed chart illustrates the relationship between education levels and jobless rates across multiple years.
Sample Task Analysis
Let’s analyze this sample task:
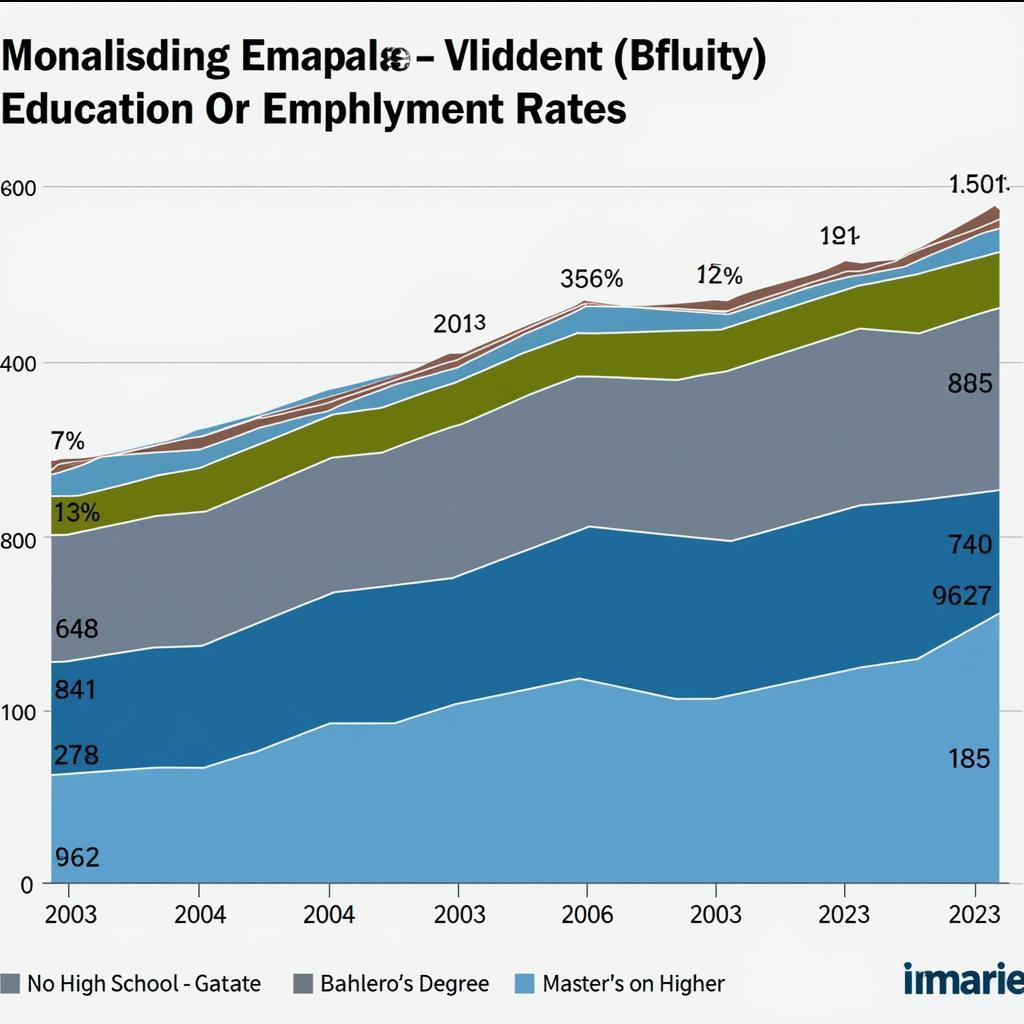
“The line graph below shows unemployment rates for four different education levels in Country X between 2000 and 2023. Summarize the information by selecting and reporting the main features, and make comparisons where relevant.”

Model Answer
The line graph illustrates how unemployment rates varied among four educational qualification levels in Country X over a 23-year period from 2000 to 2023.
Overall, people without high school education consistently experienced the highest unemployment rates throughout the period, while those with master’s degrees or higher qualifications maintained the lowest jobless figures. There was a notable correlation between higher education levels and lower unemployment rates.
Those without high school education saw their unemployment rate fluctuate significantly, starting at 12% in 2000, peaking at 16% during the 2008 financial crisis, before gradually declining to 10% by 2023. High school graduates followed a similar but less volatile pattern, with rates ranging between 8% and 12% throughout the period.
Bachelor’s degree holders maintained relatively stable unemployment rates between 4% and 7%, showing greater resilience during economic downturns. The most educated group, those with master’s degrees or higher, experienced the most stable trend, with unemployment rates consistently remaining below 4%, only briefly rising to 4.5% during the 2008 crisis.
(Word count: 134)
Key Writing Tips
Grammar Points
- Use of past tense for completed trends
- Present perfect for continuing trends
- Passive voice for formal academic writing
- Complex sentences with relative clauses
Vocabulary Focus
- fluctuate (v) /ˈflʌktʃueɪt/ – to change frequently in size, amount, or level
- volatile (adj) /ˈvɒlətaɪl/ – likely to change suddenly and unpredictably
- resilience (n) /rɪˈzɪliəns/ – ability to recover quickly from difficulties
- correlation (n) /ˌkɒrəˈleɪʃn/ – mutual relationship between two things
- downturns (n) /ˈdaʊntɜːnz/ – period of reduced economic activity
Writing Strategies for Band 7+
- Begin with a clear overview paragraph identifying main trends
- Group similar patterns together
- Use specific data points strategically
- Employ a range of comparison structures
- Maintain formal academic tone throughout
- Include both general trends and specific details
- Ensure logical paragraph organization
Remember to analyze the data thoroughly before writing and focus on the most significant trends and comparisons to achieve a high band score.