In preparation for the IELTS Writing Task 1, it is crucial for candidates to familiarize themselves with various topics, including the usage of renewable and non-renewable energy sources. The understanding of how these energy sources have evolved over time can provide valuable insights into answering questions accurately. During the period from 2000 to 2023, this topic has become increasingly relevant due to the global shift towards sustainable energy. Let’s explore this theme in depth and prepare a high-scoring response.
Sample Task 1 Prompts
-
The line graph below shows the consumption of renewable and non-renewable energy sources from 2000 to 2023. Summarize the information by selecting and reporting the main features, and make comparisons where relevant.
-
The table below gives data about the percentage of energy consumption from renewable and non-renewable sources in five countries in the year 2023. Summarize the information by selecting and reporting the main features, and make comparisons where relevant.
-
The pie charts below illustrate the share of renewable and non-renewable energy sources in global energy consumption for the years 2000 and 2023. Summarize the information by selecting and reporting the main features, and make comparisons where relevant.
Choosing a Task and Creating a Data Representation
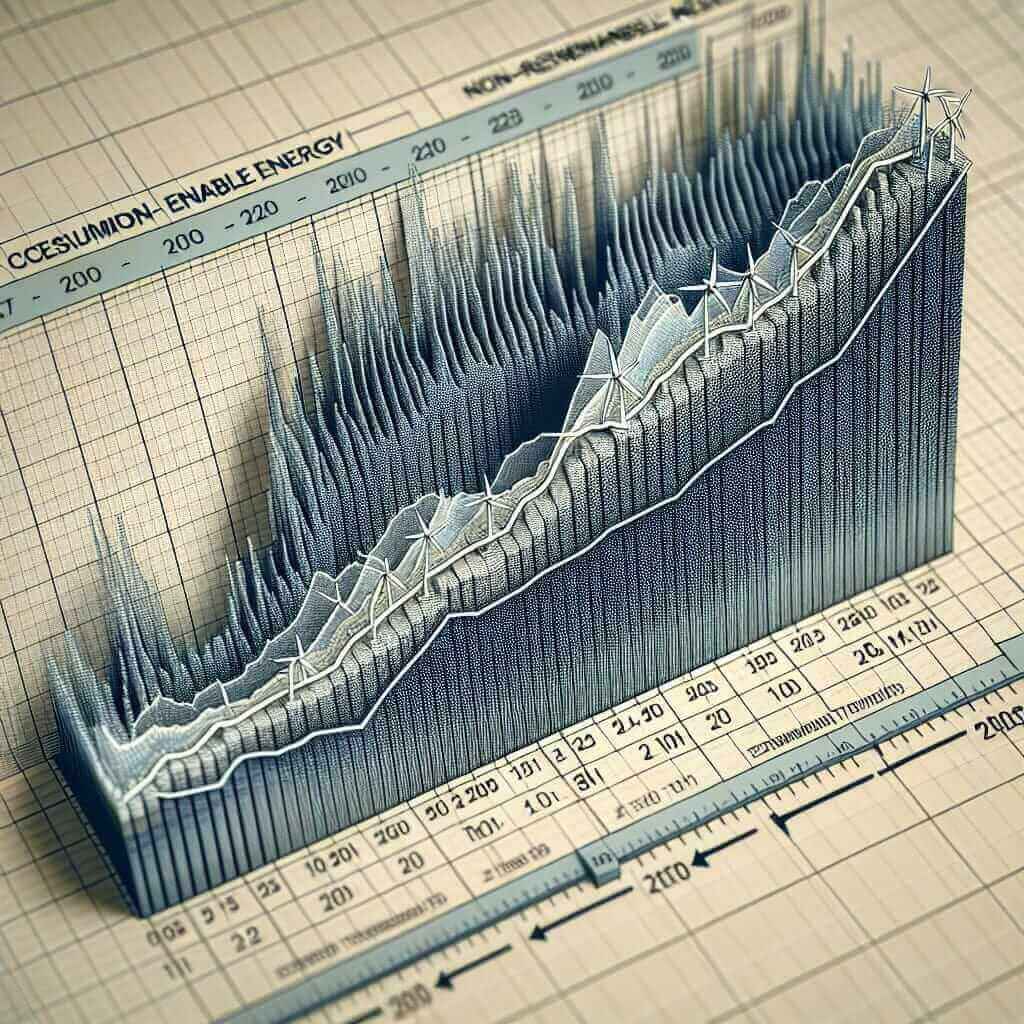
For this exercise, we will choose the first prompt: the consumption of renewable and non-renewable energy sources from 2000 to 2023. Below is a line graph detailing the data.

Task Analysis
The given line graph displays the consumption trend for renewable and non-renewable energy from the year 2000 to 2023. Key features to highlight include the overall increase in renewable energy consumption and the decrease in non-renewable energy consumption over the given period. Noting significant years where major changes occur will enhance the depth of our response.
Model Answer
The provided line graph illustrates the trend in consumption of renewable and non-renewable energy sources between 2000 and 2023. Overall, there was a noticeable increase in the usage of renewable energy, whereas consumption of non-renewable energy showed a significant decline.
In 2000, the consumption of renewable energy was relatively low at 500 TWh compared to non-renewable energy consumption, which stood at a much higher figure of 4000 TWh. Over the next five years, renewable energy usage climbed steadily to reach 800 TWh in 2005, while non-renewable energy consumption witnessed a slight reduction to 3800 TWh.
A sharp rise in renewable energy consumption is evident from 2010 onwards, with the figure surging to 1200 TWh. Concomitantly, the usage of non-renewable energy decreased more significantly, falling to 3500 TWh during the same period.
The most marked changes occurred between 2015 and 2023. By 2015, renewable energy consumption had escalated to 2000 TWh, nearly doubling the previous figure, whereas non-renewable sources continued their downward trend, dropping to 3000 TWh. This gap widened further by 2020, with renewable energy use hitting 3200 TWh as non-renewable usage plummeted to 2500 TWh.
By the end of the period in 2023, renewable energy consumption reached its peak at 3800 TWh, nearly equalling the initial consumption of non-renewable energy in 2000. On the other hand, the consumption of non-renewable energy sources had decreased to a significant low of 2000 TWh.
To conclude, the data clearly demonstrate a robust increase in the adoption of renewable energy sources, accompanied by a consistent decline in non-renewable energy usage over the span of 23 years, reflecting a global shift towards sustainability in energy consumption.
Word Count: 263
Tips for Writing Task 1 on Energy Consumption
- Tense Usage: Use past tense when describing data from the past.
- Comparative Structures: Employ comparative language (e.g., “higher than,” “increased more significantly”) to highlight differences and trends.
- Specificity in Numbers: Mention specific data points to provide evidence for your descriptions.
- Logical Sequence: Structure your writing logically, often following a time sequence, to enhance clarity.
Key Vocabulary
- Noticeable (adjective) /ˈnəʊtɪsəbl/: easily seen or noticed
- Concomitantly (adverb) /kənˈkɒmɪt(ə)ntli/: occurring at the same time
- Marked (adjective) /mɑːkt/: very noticeable
- Surge (verb/noun) /sɜːdʒ/: increase suddenly and powerfully
- Robust (adjective) /rəʊˈbʌst/: strong and healthy
Conclusion
To excel in IELTS Writing Task 1, especially with graphs related to energy consumption, it is critical to accurately describe data trends, use appropriate vocabulary and grammar, and structure your response clearly. By following these guidelines and practicing with similar prompts, achieving a Band 7+ is within reach.