As an IELTS instructor with over two decades of experience, I’ve guided countless students towards achieving their desired IELTS Writing scores. One question I frequently encounter is, “What exactly is IELTS Writing Task 1?” This comprehensive guide aims to demystify this crucial section of the IELTS exam, providing you with the knowledge and strategies to excel.
Understanding IELTS Writing Task 1
In the IELTS Writing test, you’ll encounter two tasks. Task 1 requires you to write a minimum of 150 words analyzing visual information presented in the form of:
- Charts (bar charts, pie charts, line graphs): These illustrate trends, comparisons, and changes in data over time or across different categories.
- Tables: These present data systematically in rows and columns, often requiring you to identify key features, trends, and make comparisons.
- Diagrams: These showcase processes, how something works, or illustrate changes in a structure over time.
- Maps: These depict locations, spatial relationships, and may illustrate changes in a particular area.
Your task is to accurately interpret this visual data and present it in your own words in a clear, concise, and well-organized manner.
How to Approach IELTS Writing Task 1
Successfully tackling IELTS Writing Task 1 involves a systematic approach:
1. Analyze the Visual Information Carefully
- Identify the main topic: What is the visual primarily about? What is the time frame (if applicable)?
- Understand the axes and labels: Pay close attention to units of measurement, categories, and any keys provided.
- Identify key trends, patterns, and significant features: Look for highs, lows, changes over time, or any striking differences or similarities in the data.
2. Structure Your Response Effectively
A well-structured response is crucial for clarity and coherence. Here’s a suggested structure:
- Introduction (1-2 sentences): Paraphrase the task instructions, clearly stating what the visual depicts.
- Overview (2-3 sentences): Summarize the key trends, patterns, or main features without going into specific details. This provides the examiner with a general understanding of your interpretation.
- Body Paragraphs (2-3 paragraphs): Analyze the data in detail. Each paragraph should focus on a specific trend, comparison, or group of related features. Support your statements with data from the visual.
- Conclusion (Optional – 1 sentence): This can be a concise summary of the main findings. However, it’s not strictly necessary in Task 1.
3. Use Appropriate Language and Vocabulary
- Use formal language: Avoid contractions, slang, or informal expressions.
- Paraphrase: Don’t copy words directly from the question; use synonyms and rephrase information.
- Use a range of grammatical structures: Demonstrate your command of complex sentences, conjunctions, and vocabulary related to trends, comparisons, and data analysis (e.g., increase, decrease, fluctuate, similar to, in contrast to, significantly higher, etc.).
- Be accurate with data: Use the correct figures and units of measurement.
Example from an IELTS Writing Test
Let’s examine a sample task and a possible response:
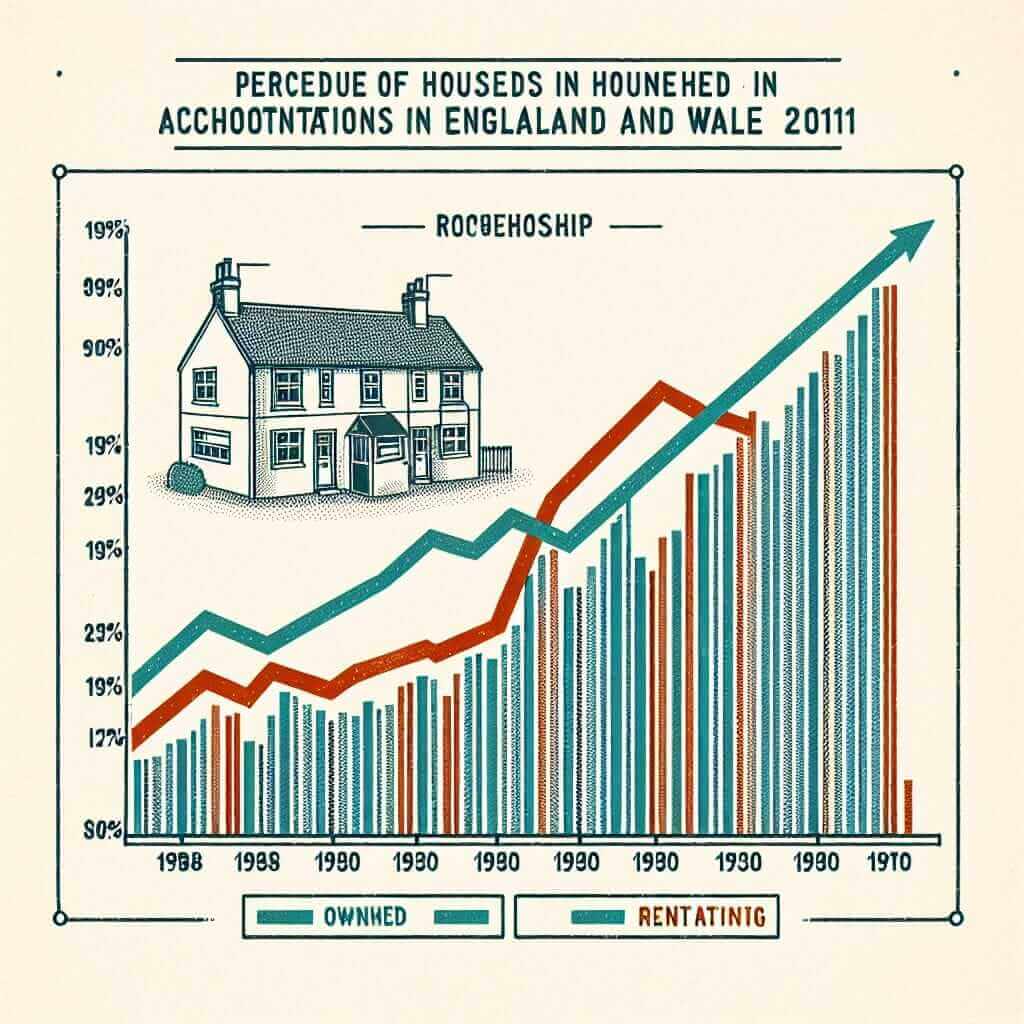
The chart below shows the percentage of households in owned and rented accommodation in England and Wales from 1918 to 2011.
(Insert appropriate chart here)

Summarize the information by selecting and reporting the main features and make comparisons where relevant.
Sample Response:
The line graph illustrates the changes in the percentage of households in England and Wales residing in owned and rented accommodation over a period of 93 years, from 1918 to 2011.
Overall, the proportion of homeowners increased significantly over the given period, while the figure for those renting showed a contrasting downward trend.
In 1918, the vast majority of households in England and Wales (around 80%) lived in rented accommodation. This figure gradually declined over the following decades, reaching approximately 50% in the 1970s. Conversely, homeownership steadily rose from a mere 20% in 1918 to reach parity with renting in the 1970s.
From the 1970s onwards, the percentage of homeowners continued to climb, reaching a peak of just over 70% in 2011. In contrast, the figure for rented accommodation experienced a sharper decline during the same period, falling to just under 30% by 2011.
Tips for Success in IELTS Writing Task 1
- Practice regularly: Familiarize yourself with different question types and visual data representations.
- Manage your time: Allocate approximately 20 minutes for Task 1, leaving sufficient time for Task 2.
- Focus on accuracy: Ensure your data interpretation is precise, and avoid making generalizations.
- Proofread carefully: Check for grammatical errors, spelling mistakes, and clarity of expression.
By following these guidelines, consistently practicing, and refining your analytical and writing skills, you can confidently approach IELTS Writing Task 1 and achieve a high score. Remember, effective communication and clear presentation of information are key to success in this section.