The IELTS Writing Task 1 is designed to assess your ability to interpret and describe visual data. This data is typically presented in the form of charts, graphs, tables, diagrams, or maps. Mastering the appropriate format for this task is crucial for achieving a high band score. This article provides a comprehensive guide to the IELTS Writing Task 1 format, equipping you with the knowledge and strategies to excel in this section.
Deconstructing the Task
The instructions for IELTS Writing Task 1 typically ask you to:
- Summarise the information by selecting and reporting the main features.
- Make comparisons where relevant.
You are expected to write at least 150 words within a time frame of 20 minutes.
Key Elements of the Format
A well-structured IELTS Writing Task 1 response typically comprises four key paragraphs:
- Introduction: Briefly paraphrase the information presented in the visual data.
- Overview: Highlight the most significant trends or patterns observed in the data.
- Body Paragraph 1: Provide a detailed description of specific data points or trends, supporting your claims with figures and comparisons.
- Body Paragraph 2: Continue describing further key features, ensuring a logical flow of information from the previous paragraph.

Illustrative Examples
Let’s analyze some examples to solidify your understanding of the format:
Example 1: Line Graph
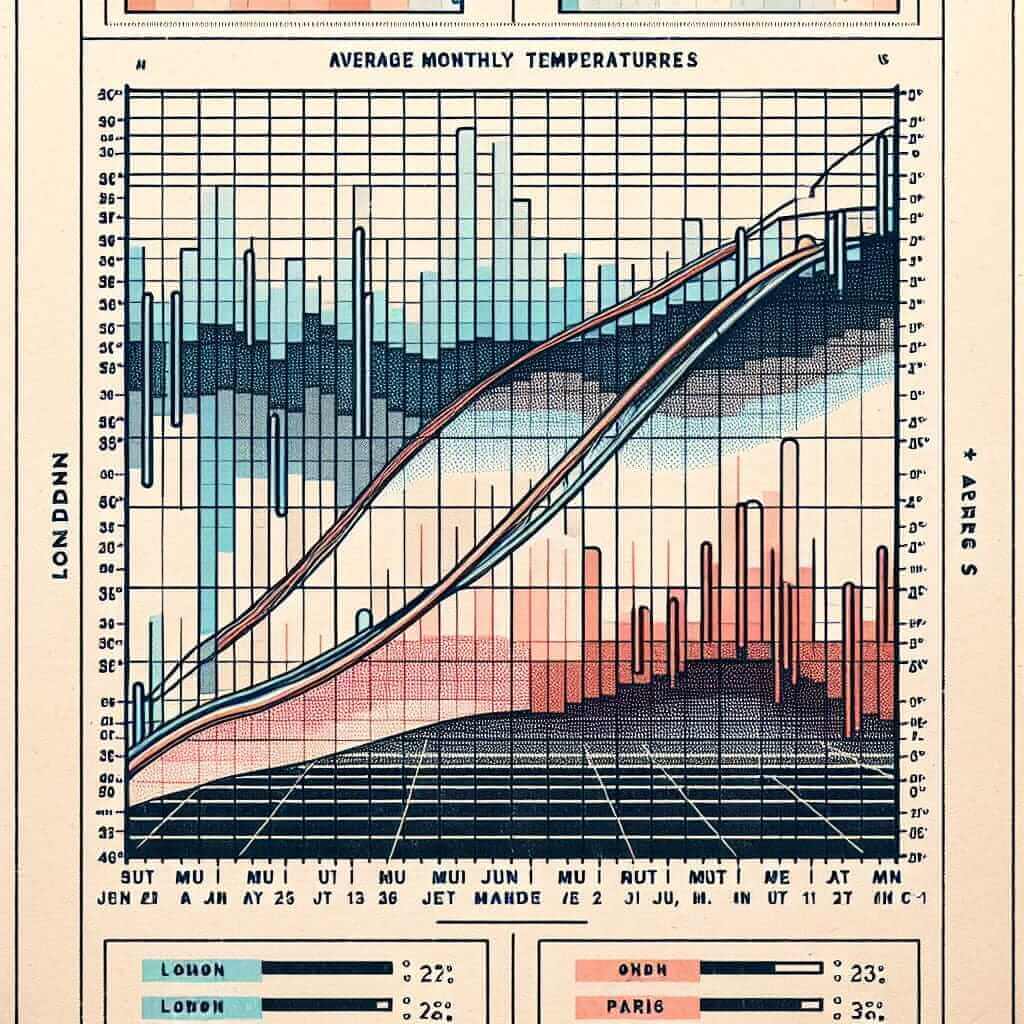
The line graph shows the average monthly temperatures in London and Paris.
Introduction: The line graph illustrates the average monthly temperatures recorded in two European cities, London and Paris.
Overview: Overall, both cities experience similar temperature trends throughout the year, with Paris showing slightly higher temperatures, particularly during the summer months.
Body Paragraph 1: In London, the temperature gradually rises from an average of 5°C in January to a peak of around 20°C in July. Subsequently, it declines steadily, reaching 5°C again by December.
Body Paragraph 2: Paris follows a similar pattern, but with warmer temperatures. It starts at 7°C in January, climbs to a maximum of 23°C in July and August, and then gradually decreases to 7°C by the end of the year.
Example 2: Bar Chart
The bar chart shows the percentage of people using different modes of transportation in a city in 1990 and 2010.
Introduction: The bar chart provides a comparative analysis of transportation preferences in a particular city between 1990 and 2010.
Overview: Over the twenty-year period, there has been a significant increase in the use of private cars and a corresponding decline in the popularity of buses.
Body Paragraph 1: In 1990, buses were the most popular mode of transportation, accounting for 45% of commuters. However, by 2010, this figure had plummeted to 20%, while car usage surged from 25% to 50%.
Body Paragraph 2: The use of bicycles and walking remained relatively stable at around 15% each year.
Common Pitfalls and How to Avoid Them
- Data Misinterpretation: Carefully analyze the visual information to avoid misinterpreting figures or trends.
- Lack of Overview: Ensure you include a clear overview summarizing the key trends, as this is crucial for a high score.
- Word Count: Practice writing concisely to meet the minimum word count requirement of 150 words.
- Repetitive Language: Utilize a range of vocabulary and grammatical structures to describe trends and comparisons.
Effective Practice Strategies
- Familiarize yourself with different question types: Analyze various charts, graphs, and diagrams to develop your data interpretation skills.
- Practice writing responses under timed conditions: This will help you manage your time effectively during the actual exam.
- Seek feedback on your writing: Have a teacher or IELTS tutor evaluate your responses to identify areas for improvement.
Conclusion
Mastering the IELTS Writing Task 1 format is essential for achieving a high band score. By understanding the structure, key elements, and common pitfalls, you can confidently approach this section of the IELTS exam. Remember to practice regularly, analyze sample responses, and seek feedback to continuously refine your skills and achieve your desired results.