As an IELTS instructor with over 20 years of experience, I understand the importance of Writing Task 1 and the anxiety it can cause for many test-takers. This comprehensive guide aims to demystify “what to write in IELTS writing task 1,” providing you with the knowledge and strategies to craft a high-scoring response.
Understanding IELTS Writing Task 1
Writing Task 1 of the IELTS Academic module requires you to write a minimum of 150 words describing visual information presented in charts, graphs, tables, diagrams, or maps. You are assessed on your ability to:
- Paraphrase: Rephrase the question prompt accurately.
- Overview: Provide a clear summary of the main trends, changes, or comparisons.
- Details: Select and describe key features with relevant data and figures.
- Structure: Organize your writing logically with clear paragraphs.
- Language: Use a range of vocabulary and grammar accurately and appropriately.
How to Approach Different Task 1 Questions
1. Line Graphs, Bar Charts, and Pie Charts:
These visual representations typically show trends over time or compare different categories.
- Introduction: Paraphrase the question prompt, clearly stating the type of chart and the information it displays.
- Overview: Identify the most significant trend(s) or pattern(s). For example, an overall increase, a significant difference, or a noticeable trend reversal.
- Body Paragraphs: Divide your description into logical paragraphs, focusing on key features and supporting them with data. Use appropriate vocabulary for trends (e.g., increase, decrease, fluctuate, plateau) and comparisons (e.g., significantly higher, considerably lower, relatively stable).
2. Tables and Charts with Numerical Data:
These often present a large amount of data in rows and columns, requiring careful analysis and selection.
- Introduction: Similar to charts, state the type of data presented and its context.
- Overview: Highlight the most significant figures or differences between categories. Avoid simply listing all the data points.
- Body Paragraphs: Group data logically to make comparisons. Use language that highlights trends, differences, and proportions (e.g., accounted for the largest proportion, experienced a threefold increase).
3. Processes and Diagrams:
These visuals illustrate how something works or the stages involved in a process.
- Introduction: Briefly describe the process or object shown in the diagram.
- Overview: State the number of stages involved and their overall purpose.
- Body Paragraphs: Describe each stage in a clear and logical sequence, using appropriate sequencing words (e.g., initially, subsequently, finally).
4. Maps:
These visuals usually show changes to a location over time or compare different locations.
- Introduction: Describe the type of maps and the time period or locations they represent.
- Overview: Highlight the most significant changes, differences, or similarities between the maps.
- Body Paragraphs: Describe specific changes or compare features using appropriate vocabulary for locations (e.g., to the north, in the south-west, adjacent to).
Example: Line Graph
Question:
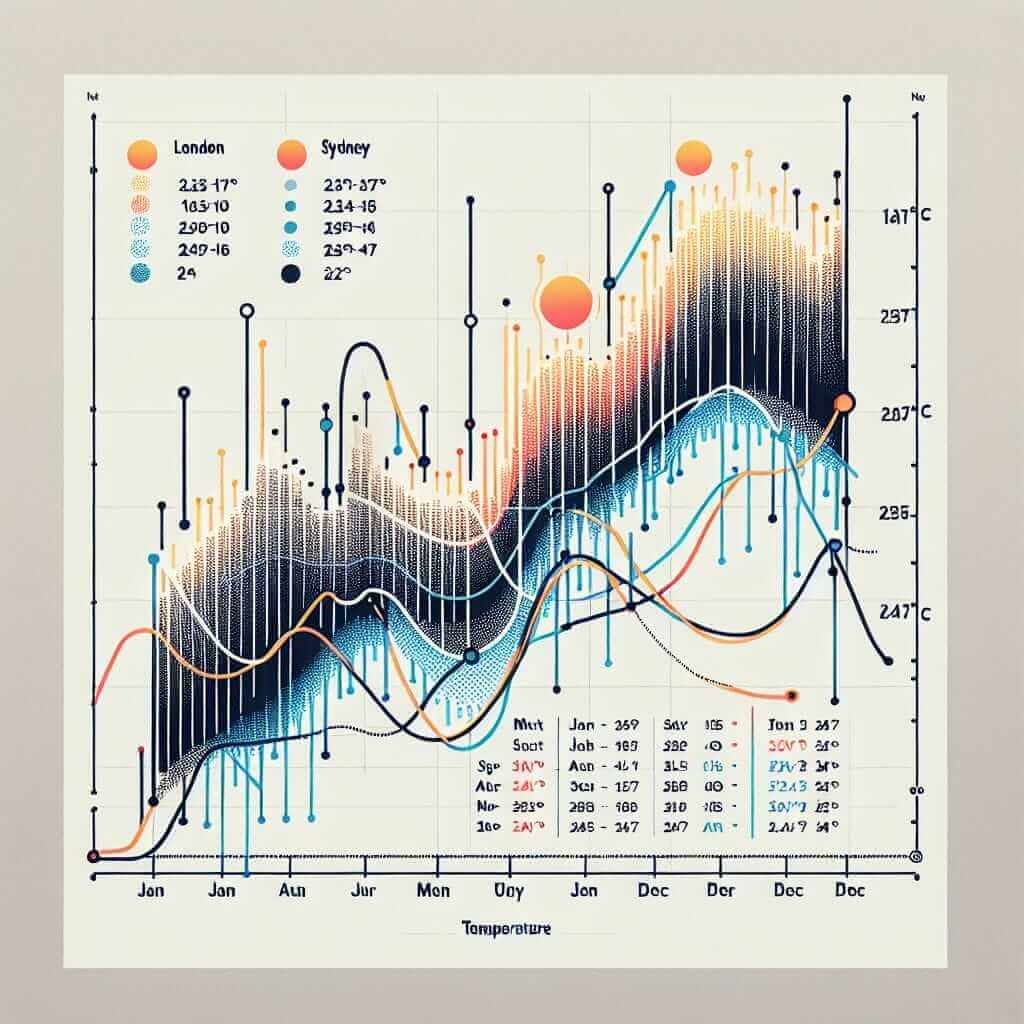
The graph below shows the average monthly temperatures in London and Sydney.

Answer:
The line graph compares the average monthly temperatures in London and Sydney over a year. Overall, Sydney experiences a warmer climate than London, with higher temperatures throughout the year.
Sydney’s hottest months are December to February, with temperatures reaching an average high of around 25 degrees Celsius. In contrast, London’s warmest months are July and August, with temperatures peaking at approximately 20 degrees Celsius.
While London’s temperatures remain relatively consistent throughout the year, Sydney experiences a more noticeable fluctuation. For instance, Sydney’s temperatures drop to an average low of 15 degrees Celsius in July, while London’s lowest average temperature is around 5 degrees Celsius in January.
Tips for Success:
- Practice Regularly: Familiarize yourself with different question types and practice writing responses under timed conditions.
- Analyze Visuals Carefully: Spend time understanding the information presented before you start writing.
- Use a Clear Structure: Organize your writing into paragraphs with a clear introduction, overview, and supporting details.
- Focus on Accuracy: Ensure your data and figures are accurate and consistent with the visual information.
- Proofread Thoroughly: Check your grammar, spelling, and punctuation before submitting your response.
Conclusion
Mastering IELTS Writing Task 1 requires a clear understanding of the task requirements, consistent practice, and a strategic approach to analyzing and presenting visual information. By following the guidelines and tips provided in this guide, you can enhance your writing skills and approach the exam with confidence.