Introduction
In the IELTS Academic Writing exam, Task 1 presents you with a visual representation of data, often in the form of a graph, chart, table, or diagram. Your mission? To accurately and effectively summarize this data in the form of a report. This report isn’t about showcasing your personal opinions or interpretations; rather, it’s about demonstrating your ability to objectively analyze and present information in a clear, concise, and organized manner.
The Importance of the Report
The IELTS Writing Task 1 report serves a specific purpose – it assesses your ability to:
1. Comprehend and Analyze Visual Data: Can you quickly grasp the key trends, patterns, and significant details presented in a visual format?
2. Convey Information Effectively: Can you translate complex data into a written report that is easy to understand, even for someone unfamiliar with the original visual?
3. Use Academic Writing Conventions: Are you comfortable using appropriate vocabulary, grammar, and sentence structures expected in an academic setting?
4. Manage Time Efficiently: Can you complete a well-structured and informative report within the allocated time limit of 20 minutes?
Mastering these skills is not only crucial for a good IELTS score but also for academic success and professional communication in an increasingly data-driven world.
Crafting an Effective IELTS Report
Let’s break down the key elements of a successful report:
1. Introduction (Paraphrase): Begin by paraphrasing the given task instruction. This demonstrates your understanding of the task and your ability to rephrase information using different words.
2. Overview (Key Trends): This is a crucial part of your report. In one or two sentences, summarize the most important trends or patterns you observe in the visual data. Avoid going into specific details here; save those for the body paragraphs.
3. Body Paragraphs (Detailed Analysis): Divide your analysis into two to three body paragraphs. Each paragraph should focus on a specific aspect of the data, highlighting key changes, comparisons, or trends with supporting figures or data points. Use linking words and phrases to ensure a smooth flow between sentences and paragraphs.
4. Conclusion (Optional): A concluding sentence is not mandatory for Task 1. However, if you choose to include one, briefly restate the main trend or offer a general observation based on the data analysis. Avoid introducing new information in the conclusion.
Example: From Graph to Report
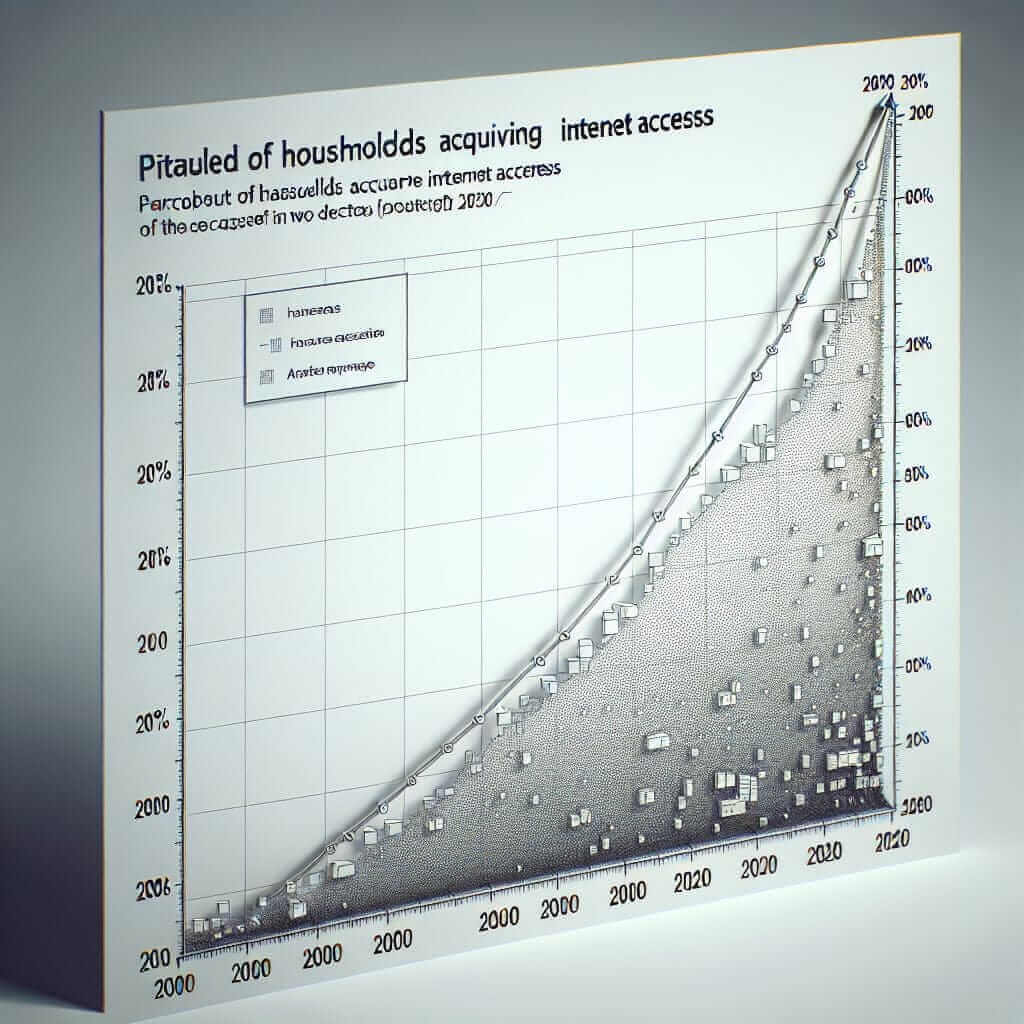
Task: The graph below shows the percentage of households with internet access in a certain country between 2000 and 2020.

Sample Report:
The line graph illustrates the proportion of homes in a particular country that had internet access over a two-decade period, from 2000 to 2020.
Overall, there was a significant increase in the percentage of households with internet access during this time frame. In 2000, just 15% of homes had access to the internet. However, this figure rose steadily over the next twenty years, reaching 85% by 2020.
The most dramatic increase occurred between 2005 and 2010, when internet access in homes more than doubled, jumping from 25% to 60%. This growth can likely be attributed to the increasing availability of affordable broadband internet services during that period.
Tips for Success
- Practice Regularly: Familiarize yourself with different types of visual data and practice writing reports under timed conditions.
- Expand Your Vocabulary: Build a strong vocabulary related to trends, comparisons, and data interpretation to enhance your writing.
- Focus on Accuracy: Ensure your report accurately reflects the data presented. Avoid making assumptions or drawing conclusions that are not supported by the visual.
- Seek Feedback: Have your practice reports reviewed by an experienced IELTS instructor for valuable feedback on your writing style, grammar, and data interpretation skills.
Conclusion
Mastering the IELTS Writing Task 1 report is achievable with focused practice and a clear understanding of the assessment criteria. Remember, your goal is to demonstrate your ability to objectively analyze and present information in a clear, concise, and well-structured manner. By honing your analytical and writing skills, you’ll be well-equipped to excel in this section of the IELTS exam.